Stocks continued weak with a lower open on Tuesday, but quickly reversed and moved sharply higher the rest of the day. Selling pressure was limited to the first 30 minutes as the S&P 500 dipped below 1192 by 10AM. Things quickly changed. By 11AM, the S&P 500 was trading above 1200 and continued higher the rest of the day with a big surge around 3PM. Note that $SPX was already strong and trading near 1215 before this late surge, which was attributed to a report from the Telegraph, a UK newspaper. Rumors suggested that EU leaders agreed to a massive bailout effort with a 2 trillion Euro number tossed about. This story may or may not have sparked a big surge around 3PM. I have my doubts. The Telegraph is a fine paper, but it is certainly not the Financial Times, Wall Street Journal or Bloomberg. Furthermore, it is a UK based paper, not a French or German paper. The French and Germans form the core of EU leadership. Rumors like this are akin to the iPhone 5 rumors. Remember all those leaked prototypes and specifications? The iPhone 5 never materialized. Media speculation is just that. As with the core leadership at Apple, only the core leadership in the EU really knows what is going on. The only thing we can be certain about is that some plan will be announced in the next 1-2 weeks. Exactly when and how much we simply have to wait and see. In the meantime, traders can expect more fireworks and volatility as rumors and earnings push prices around throughout the day (and night).
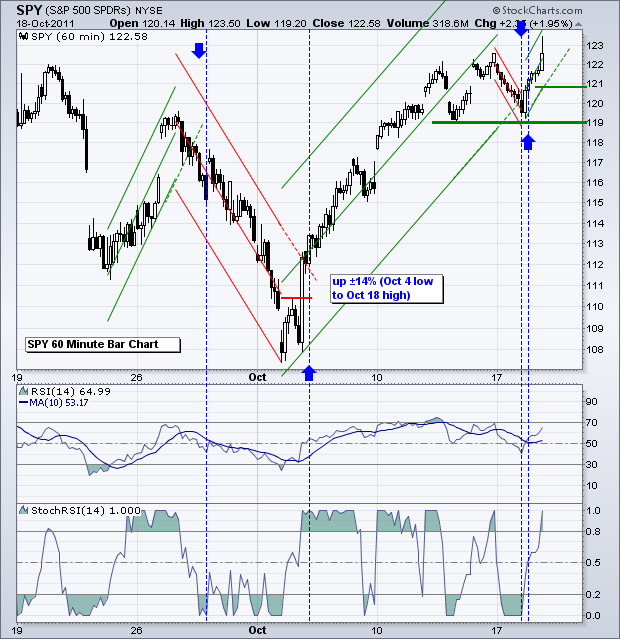
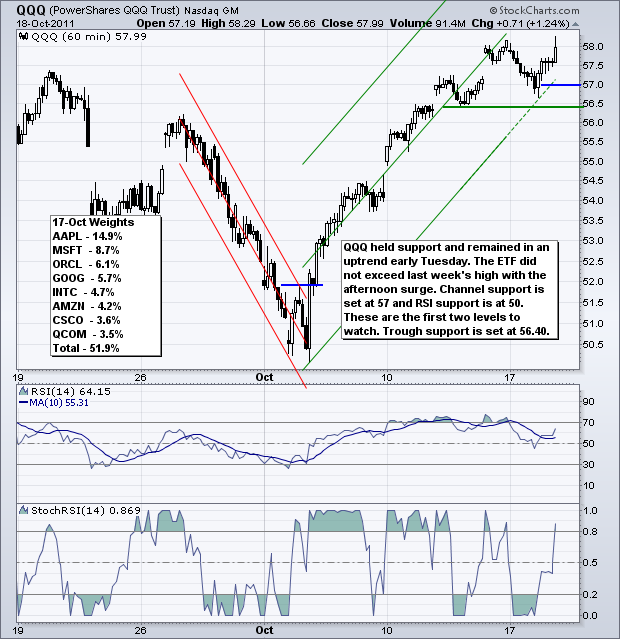
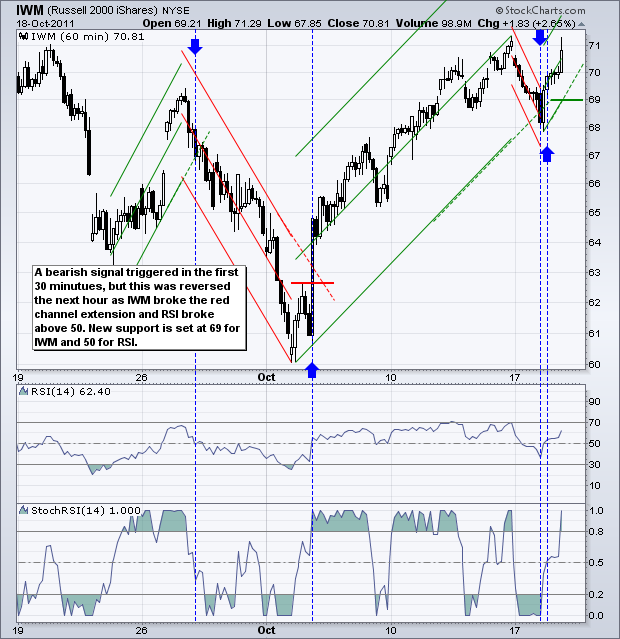
Turning back to the price charts, the S&P 500 ETF (SPY) broke the lower extension of the Raff Regression Channel in the first 30 minutes, but quickly recovered and surged back above 121 by midday. First, the move below 120 turned the bulk of the short-term evidence bearish. SPY broke the Raff Regression Channel extension and RSI moved below 50. Note that RSI and StochRSI have been set at 14 across the board, which is the default setting. A new bearish signal requires new annotations. In particular, a new Raff Regression Channel extending down from the recent high (red). SPY broke this channel extension with the surge above 121 and RSI moved back above 50. With an intraday signal, a new Raff Regression Channel is required from yesterday's low. The extension marks support at 120.80 and the key level for RSI remains at 50. Current swings and signals are much faster and more frequent than I like, but I will update the charts as long as there are directional changes.
**************************************************************************
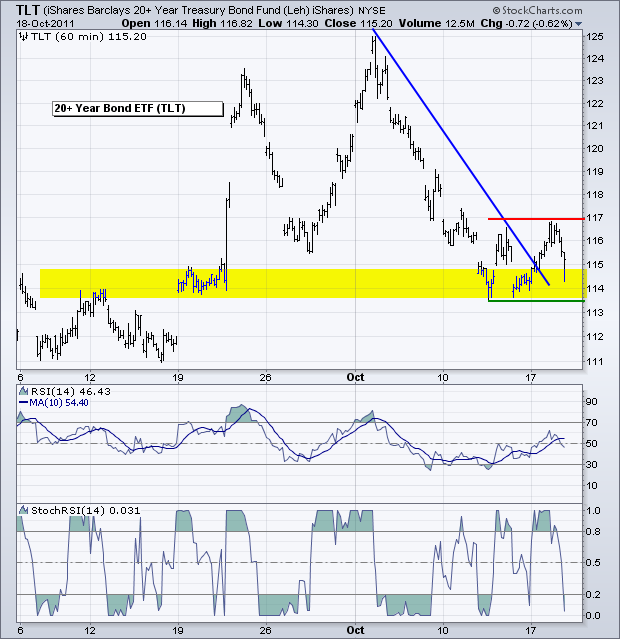
The 20+ year Bond ETF (TLT) hit support in the 114 area and moved into a trading range. Support is set at 113.5 and resistance at 117. A break from this range will provide the next directional signal. Treasuries will likely take their cue from stocks and the Euro. Weakness in these two would trigger a breakout, while further strength would continue the short-term downtrend.
**************************************************************************
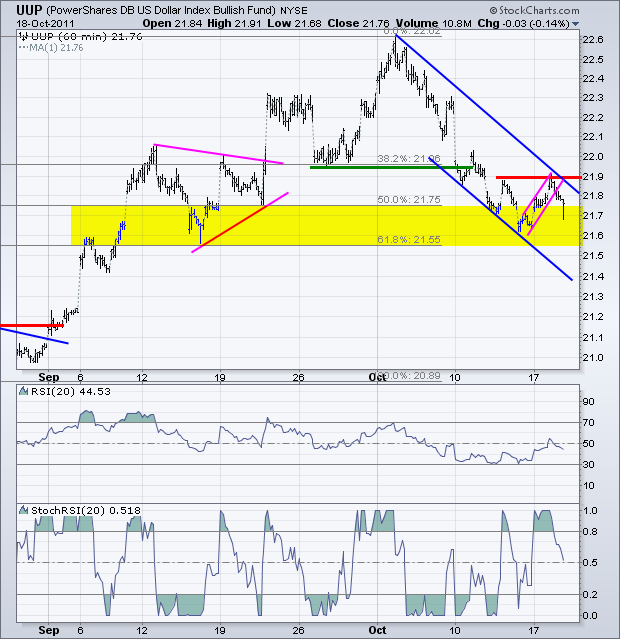
The US Dollar Fund (UUP) attempted a breakout as stocks opened weak on Tuesday, but this attempt failed as stocks immediately rebounded. While I am still looking for a reversal in the 50-61.80% retracement zone, the short-term trend remains down with resistance at 21.90. RSI failed to hold its move above 50 and momentum is back with the bears.
**************************************************************************
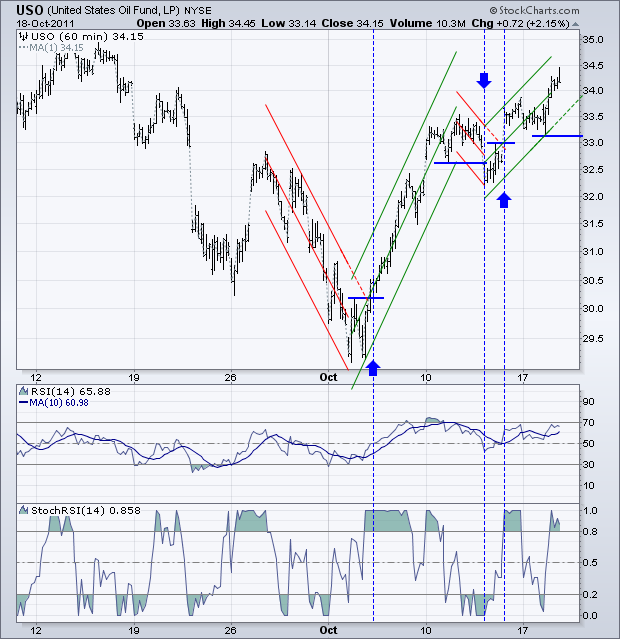
The US Oil Fund (USO) got a little whipsaw with the brief dip below 32.50, but recovered with a surge above 33.50 the very next day. After a drawing two more Raff Regression Channels, the current swing is up with support marked at 33.10. RSI remains in bull mode as long as it is above 50.
**************************************************************************
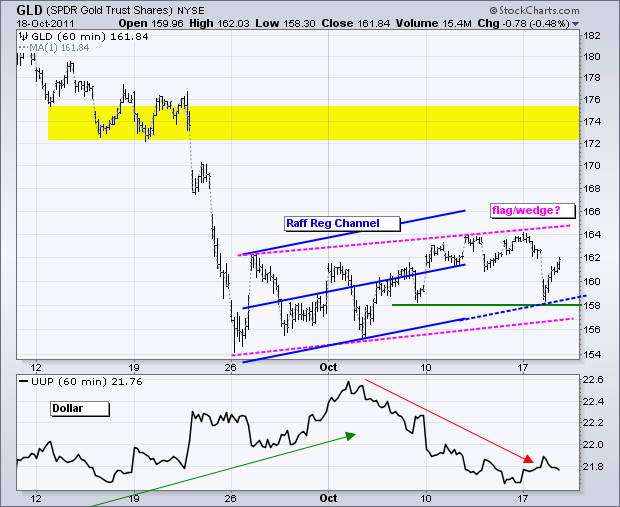
The Gold SPDR (GLD) also got sucked into Tuesday's volatility. GLD broke support at 160, but quickly rebounded and closed near 162. The trend since late September is up, but ever so slightly. The pink lines show a rising channel, which is a rising flag on the daily chart. The blue lines show a Raff Regression Channel with the lower extension holding on Tuesday. Note that the Raff Regression Channel extends from the closing low to the closing high of the current move. I am marking key support at 158.
**************************************************************************
Key Economic Reports:
Wed - Oct 19 - 07:00 - MBA Mortgage Index
Wed - Oct 19 - 08:30 - CPI
Wed - Oct 19 - 08:30 - Housing Starts/Building Permits
Wed - Oct 19 - 10:30 - Crude Inventories
Wed - Oct 19 - 14:00 - Fed's Beige Book
Thu - Oct 20 - 08:30 - Initial Claims
Thu - Oct 20 - 10:00 - Existing Home Sales
Thu - Oct 20 - 10:00 - Philadelphia Fed
Thu - Oct 20 - 10:00 - Leading Indicators
Sun - Oct 23 – 23:59 – G20 Deadline for EU Leaders!
Charts of Interest: Tuesday and Thursday in separate post.
This commentary and charts-of-interest are designed to stimulate thinking. This analysis is not a recommendation to buy, sell, hold or sell short any security (stock ETF or otherwise). We all need to think for ourselves when it comes to trading our own accounts. First, it is the only way to really learn. Second, we are the only ones responsible for our decisions. Think of these charts as food for further analysis. Before making a trade, it is important to have a plan. Plan the trade and trade the plan. Among other things, this includes setting a trigger level, a target area and a stop-loss level. It is also important to plan for three possible price movements: advance, decline or sideways. Have a plan for all three scenarios BEFORE making the trade. Consider possible holding times. And finally, look at overall market conditions and sector/industry performance.

