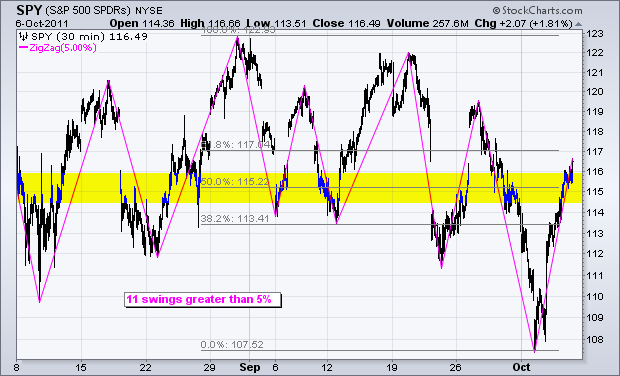
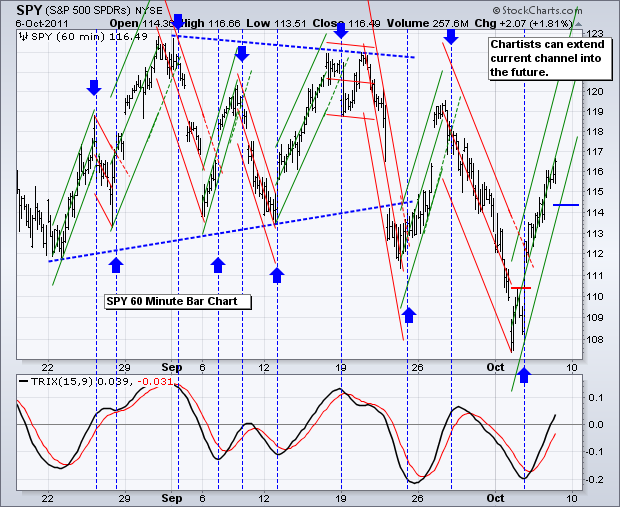
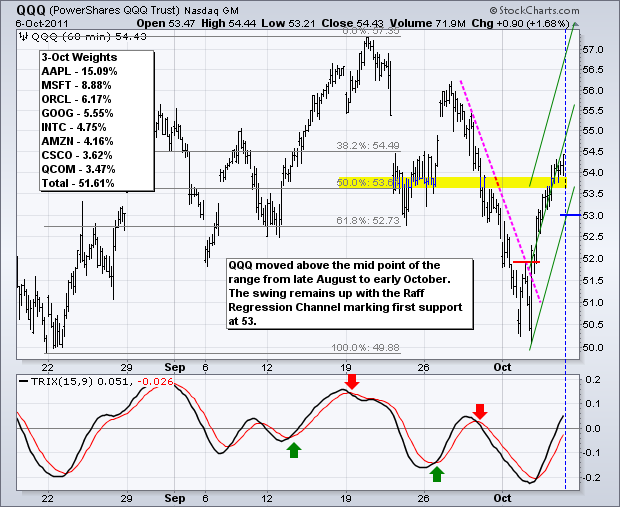
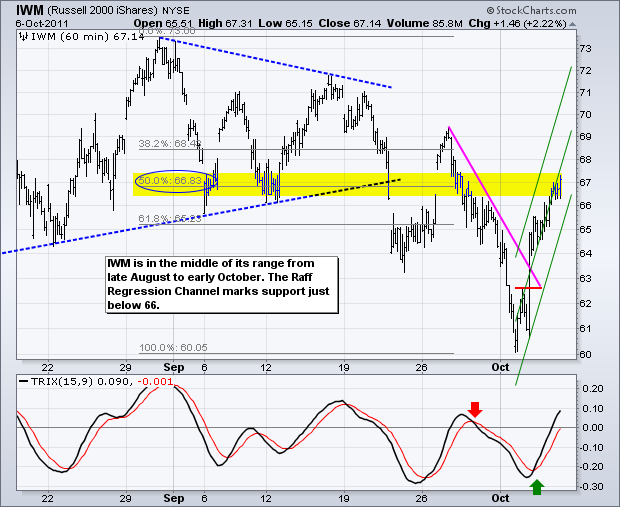
There is nothing to do now, but wait for the market's reaction to the employment report. The current swing for stocks remains up. Since early August, the S&P 500 ETF (SPY) has 11 swings that are at least 5 percent. The ETF started August with a plunge below 115 and moved back above this level with yesterday's close. The range from late August to early October extends from 123 to 107.5, which puts 115.25 in the middle. SPY is trading just above the mid point of its two month range. Basically, the ETF has gone nowhere. In reality, the ETF is all over the place with massive swings that last 3-7 days. 11 swings in eight weeks averages out to one swing every 3.63 days. Traders can either take these swings or sit back and wait for the market to calm down.
**************************************************************************
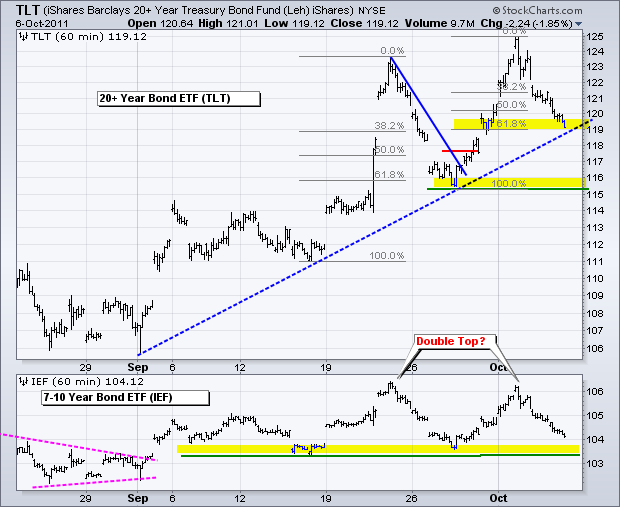
The 20+ year Bond ETF (TLT) is now hostage to the employment report. A better-than-expected report would be negative for bonds, while a worse-than-expected report would be positive. TLT is currently at support from the 61.80% retracement and early September trendline. Next support resides in the 116 area. Notice that IEF (indicator window) may be tracing out a small Double Top the last few weeks.
**************************************************************************
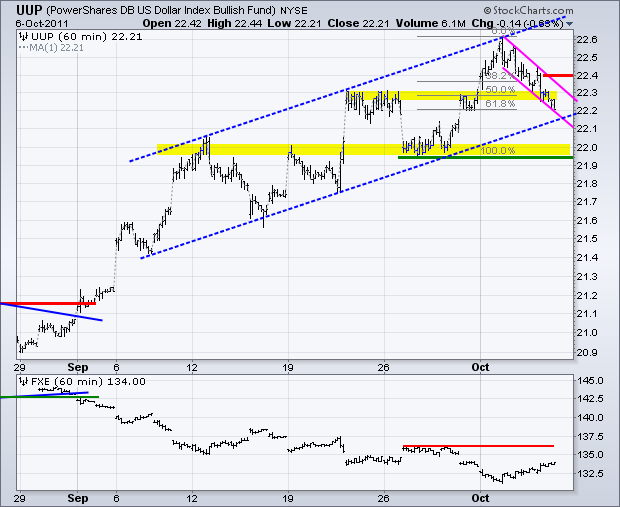
The US Dollar Fund (UUP) is also at a moment-of-truth. The ETF retraced 61.80% of the prior surge with a falling flag this week. There is also support in this area from the lower trendline of a rising channel. A move above 22.4 would break flag resistance and call for a continuation of the bigger uptrend.
**************************************************************************
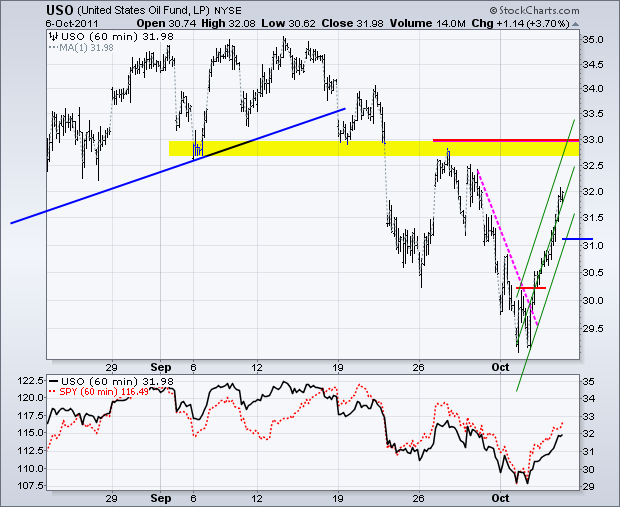
The US Oil Fund (USO) blew through the Fibonacci cluster put forth on Thursday and is fast approaching a bigger resistance zone in the 32.5-33 area. Resistance here stems from broken supports and the late September high. Strength in global equities this week is putting a bid in oil. The swing is up with the Raff Regression Channel marking first support at 31.10.
**************************************************************************
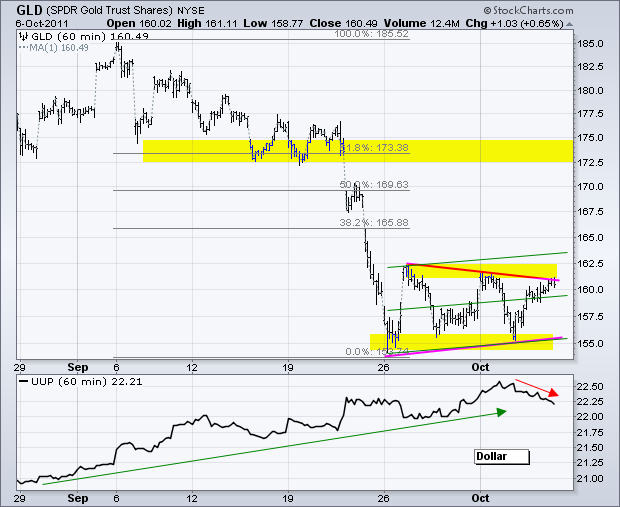
The Gold SPDR (GLD) got a bounce this week as the Dollar corrected. Overall, GLD remains within a triangle formation and is currently testing resistance. A breakout at 162.5 would be bullish for gold and argue for a move to the next resistance zone. Support is set at 155 and confirmed by the Raff Regression Channel. A break here would signal a continuation lower.
**************************************************************************
Key Economic Reports:
Fri - Oct 07 - 08:30 - Employment Report
Fri - Oct 07 - 15:00 - Consumer Credit
Charts of Interest: Tuesday and Thursday in separate post.
This commentary and charts-of-interest are designed to stimulate thinking. This analysis is not a recommendation to buy, sell, hold or sell short any security (stock ETF or otherwise). We all need to think for ourselves when it comes to trading our own accounts. First, it is the only way to really learn. Second, we are the only ones responsible for our decisions. Think of these charts as food for further analysis. Before making a trade, it is important to have a plan. Plan the trade and trade the plan. Among other things, this includes setting a trigger level, a target area and a stop-loss level. It is also important to plan for three possible price movements: advance, decline or sideways. Have a plan for all three scenarios BEFORE making the trade. Consider possible holding times. And finally, look at overall market conditions and sector/industry performance.

