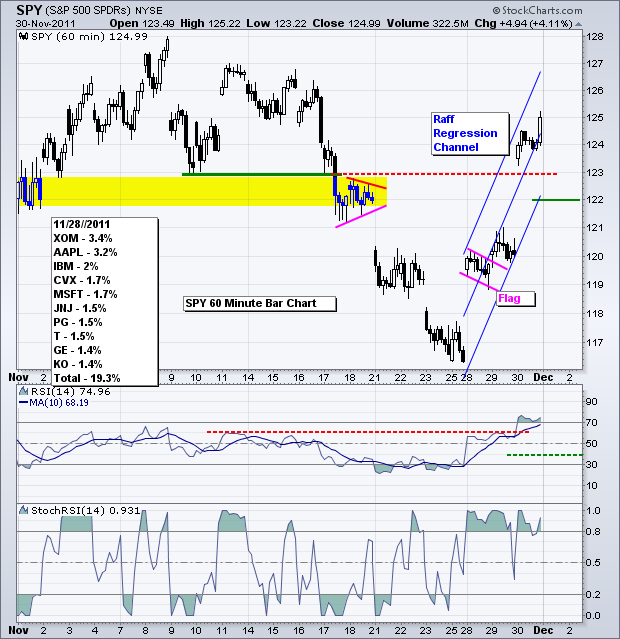
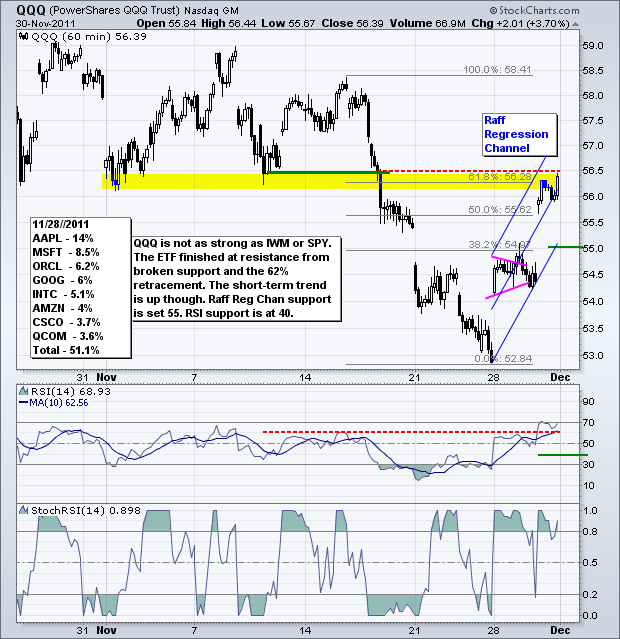
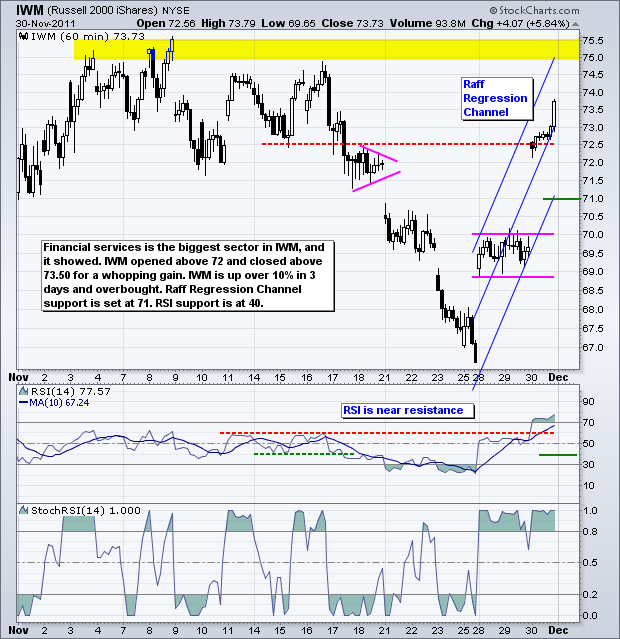
Coordinated action from five central banks sparked a massive rally in the finance sector (+6.17%) that extended to the rest of the market. All sectors were up. Seven of nine were up more than 3%. Utilities and consumer staples were up less than 3%. The materials, energy, finance and industrials sectors were up more than 5%. Rumors indicate that the coordinated central bank action was to bailout a major European bank on the brink of insolvency. Cutting the interest rate on Dollar swaps helps only the big global banks with their short-term funding requirements. It does not fix, or even help, the European debt problem. It does not stimulate retail spending in the US. It should, however, be noted that the private sector added 206,000 jobs in November, which was a better-than-expected number from the ADP Employment report. This is positive for the US economy and could help retail spending. On the price chart, the S&P 500 ETF (SPY) opened above 123 and closed at 125. It was a strong start and strong finish. The short-term trend is up, but very steep, which makes it challenging to set support. I am going to use the Raff Regression Channel and RSI to set support. The current channel ends around 122 so I will set this level as first support. RSI support is set at 40.
**************************************************************************
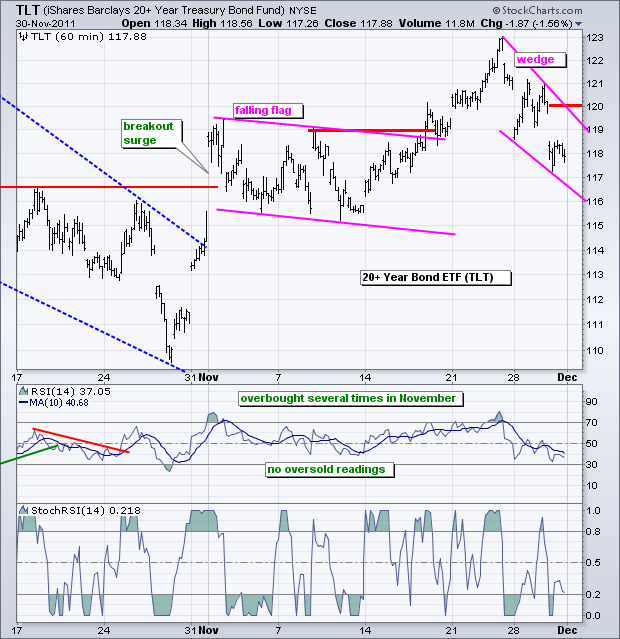
The 20+ year Bond ETF (TLT) opened weak and remained weak with a close below 118. A falling wedge has taken shape the last few days with resistance at 120. A better-than-expected ADP Employment Report, strength in stocks and rising commodity prices weighed on treasuries.
**************************************************************************
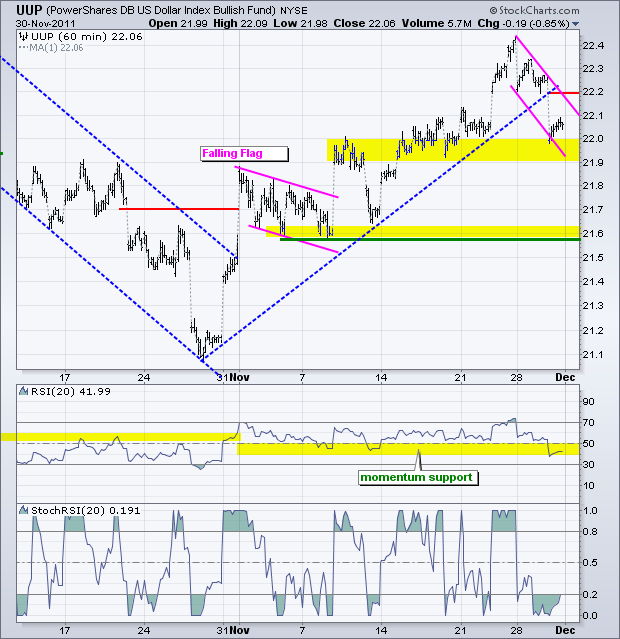
The Euro surged along with European banks, European stocks and US stocks. The US Dollar Fund (UUP) declined to a support zone in the 21.9-22 area. This zone stems from broken resistance and the mid November lows. RSI also fell to its support zone in the 40-50 area. This is the first test. A falling flag has taken shape the last few days. It would take a break above 22.20 to reverse this fall and signal a continuation of the bigger uptrend.
**************************************************************************
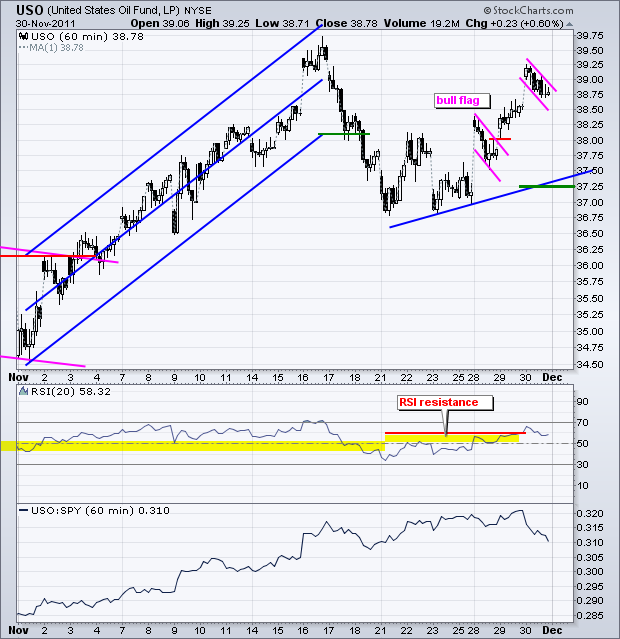
The US Oil Fund (USO) surged along with the stock market and the Euro. Despite this positive double whammy, the ETF did not close on its high and moved lower after the open. Nevertheless, the overall trend is up and a small falling flag formed on Wednesday. A break above 39.10 would signal a continuation higher.
**************************************************************************
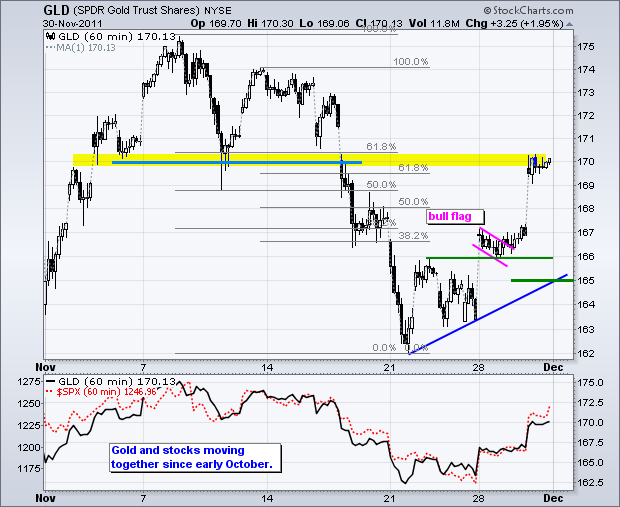
Gold also got the bullish double whammy with strength in stocks and weakness in the Dollar. The Gold SPDR (GLD) broke flag resistance on Tuesday and surged above 169 on Wednesday. There is potential resistance in this area from broken support and the 61.80% retracement cluster. Despite resistance, the short-term trend is clearly up. I will mark support at 165 for now.
**************************************************************************
Key Economic Reports:
Thu - Dec 01 - 08:30 - Jobless Claims
Thu - Dec 01 - 10:00 - ISM Services Index
Thu - Dec 01 - 10:00 - Construction Spending
Thu - Dec 01 - 15:00 - Auto/Truck Sales
Fri - Dec 02 - 08:30 – Employment Report
Charts of Interest: Tuesday and Thursday in separate post.
This commentary and charts-of-interest are designed to stimulate thinking. This analysis is not a recommendation to buy, sell, hold or sell short any security (stock ETF or otherwise). We all need to think for ourselves when it comes to trading our own accounts. First, it is the only way to really learn. Second, we are the only ones responsible for our decisions. Think of these charts as food for further analysis. Before making a trade, it is important to have a plan. Plan the trade and trade the plan. Among other things, this includes setting a trigger level, a target area and a stop-loss level. It is also important to plan for three possible price movements: advance, decline or sideways. Have a plan for all three scenarios BEFORE making the trade. Consider possible holding times. And finally, look at overall market conditions and sector/industry performance.

