This market is just itching to continue higher. As I write, the Dow futures are of over 100 points. Hints of a European deal are in the air, the US economic numbers have been pretty good and central banks are printing money. What more could a stock market want? Even though everybody and their dog are bearish on the Euro, it is still trading above 1.30. The bigger trend is down, but the Forex market does NOT envision a complete collapse. Keep in mind that all known news is already priced into the currency. I would also guesstimate that their will be some sort of deal coming out of Europe that will involve the ECB embarking on quantitative easing. Think what this kind of news would do to the stock markets around the world. Right or wrong, central bankers learned from Lehman and are unlikely to let something like that happen again. Even if you are a bearish on Europe and the US stock market, don't forget that the markets can remain irrational a lot longer than you can remain solvent! I would also forget about the low volume argument. Price is the only thing that really counts. Exchange volume ain't what it used to be. There are competing exchanges, ETFs, dark pools and other avenues for the big traders (institutions).
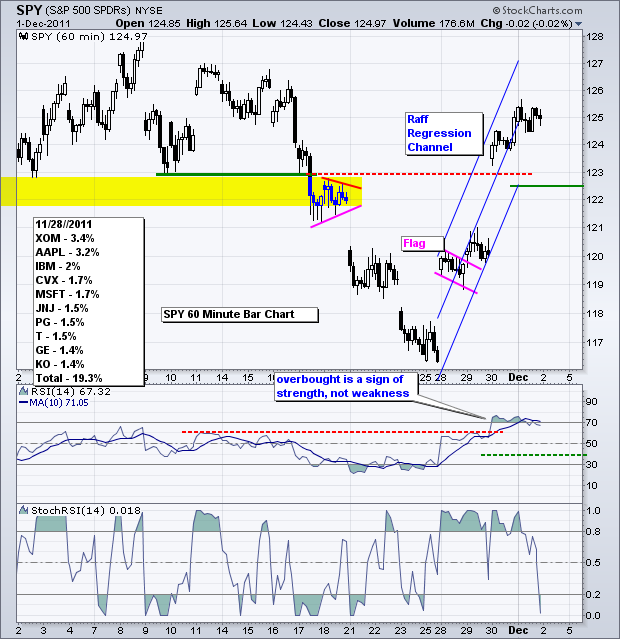
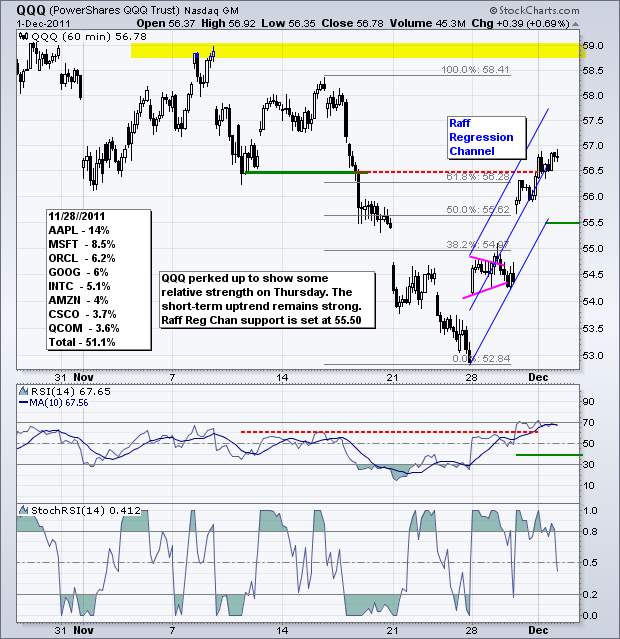
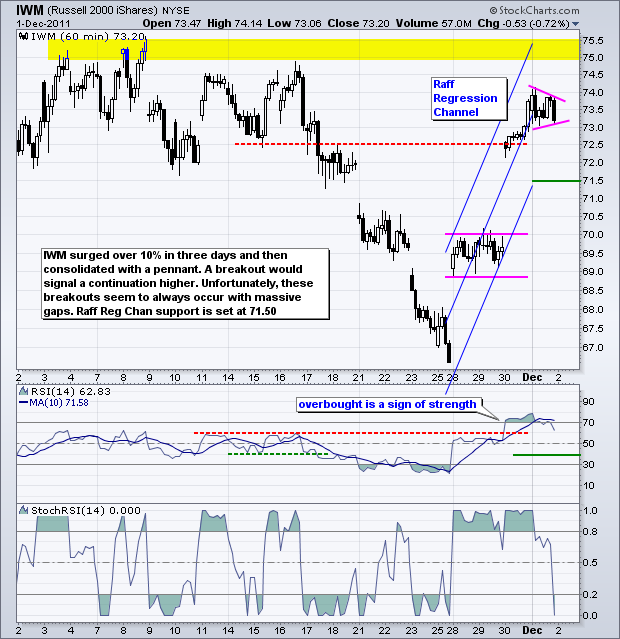
Turning to the chart, which is the only thing that really matters, the S&P 500 ETF (SPY) gapped up and broke above 123 on Wednesday. SPY held this gap and edged higher. Selling pressure did not appear. I extended the Raff Regression Channel, which now marks key support at 122.50. RSI surged above 70 on Wednesday. A move into overbought territory is a sign of strength, not weakness. It takes strong buying pressure to push momentum this far. We have seen an abrupt change over the last two weeks, but I think the current move (up) carries more weight than the past move (down).
**************************************************************************
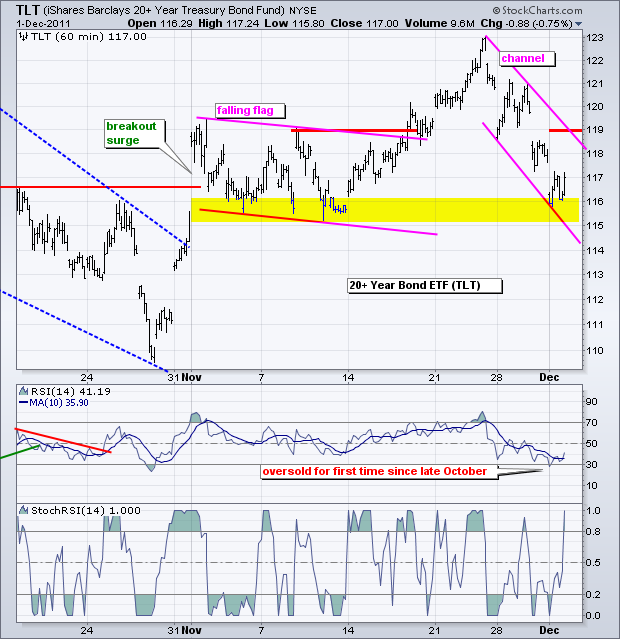
The 20+ year Bond ETF (TLT) continued lower within a falling channel. It could be a flag, but the pattern looks too big relative to the prior advance (late November 115-123). TLT is coming up to a big support test in the 115-116 area. This is the breakout that coincided with the November plunge in stocks. Failure to hold this would have medium-term consequences. RSI moved to oversold levels for the first time since late October. This is also a sign of a short-term trend change.
**************************************************************************
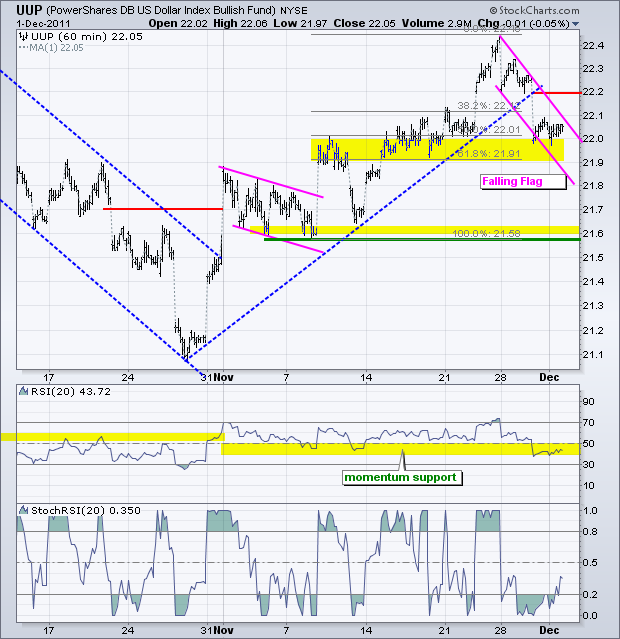
The US Dollar Fund (UUP) plunged to support in the 21.9-22 area and firmed the last two days. The swing remains down, but the overall trend since late October is up. A falling flag has taken shape as the ETF retraced 50-61.80% of the prior advance. A break above flag resistance would signal a continuation higher. RSI is trading in its support zone (40-50). This is the moment-of-truth for UUP. While a QE announcement from the ECB would prevent a collapse of the Euro, it would be dilutive and could put downward pressure on the currency.
**************************************************************************
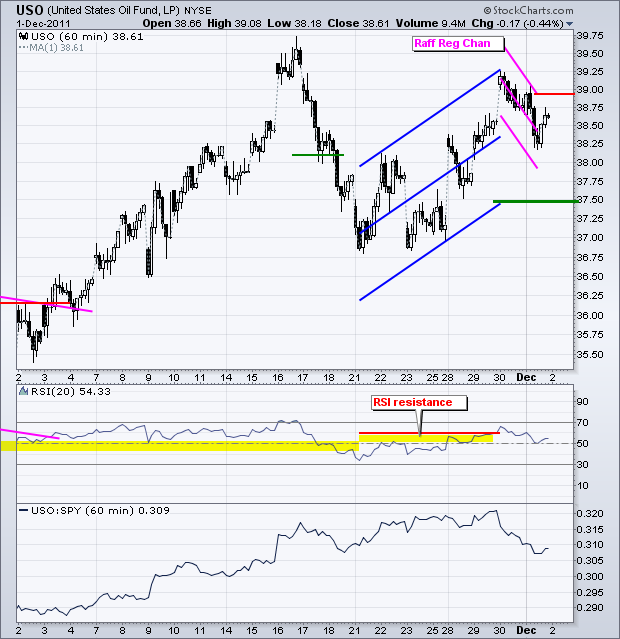
The US Oil Fund (USO) remains in an uptrend overall. What happens when flag or channel trendlines do not match up or are not parallel? Sometimes there is a zigzag pattern, up or down, but the trendlines expand to form an odd looking megaphone pattern. In these cases, I often use the Raff Regression Channel to define the channel. The blue Raff Regression Channel defines the upswing since November 21st and marks support at 37.50. The pink lines define the downswing the last few days, I would consider this a falling flag type pattern with resistance at 38.90
**************************************************************************
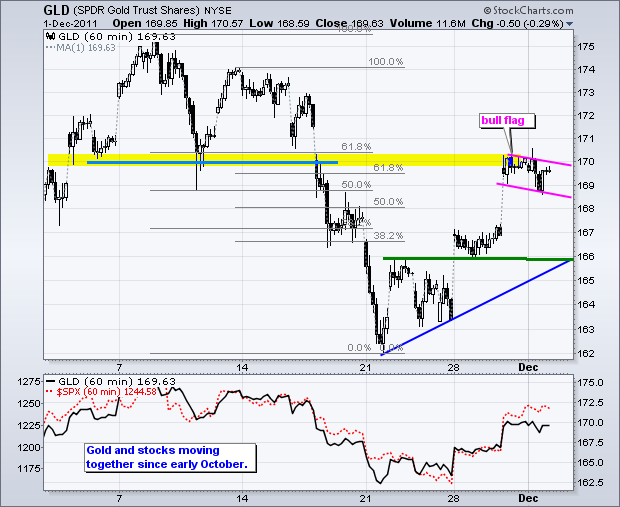
The Gold SPDR (GLD) surged to resistance in the 170 are and consolidated with a falling flag. Resistance here stems from broken support and the 61.80% retracement. A break above flag resistance signals another continuation higher. Gold is currently moving in the same direction as the stock market so keep an eye on stocks for clues on gold.
**************************************************************************
Key Economic Reports:
Fri - Dec 02 - 08:30 – Employment Report
Charts of Interest: Tuesday and Thursday in separate post.
This commentary and charts-of-interest are designed to stimulate thinking. This analysis is not a recommendation to buy, sell, hold or sell short any security (stock ETF or otherwise). We all need to think for ourselves when it comes to trading our own accounts. First, it is the only way to really learn. Second, we are the only ones responsible for our decisions. Think of these charts as food for further analysis. Before making a trade, it is important to have a plan. Plan the trade and trade the plan. Among other things, this includes setting a trigger level, a target area and a stop-loss level. It is also important to plan for three possible price movements: advance, decline or sideways. Have a plan for all three scenarios BEFORE making the trade. Consider possible holding times. And finally, look at overall market conditions and sector/industry performance.

