The negotiation marathon continues in Brussels. The 27-nation block fell apart as the UK and Hungary opted out of the current deal. Eurocrats are, however, making progress with the remaining 17 plus 6 or so. Nobody really expected an earth shattering agreement that would completely solve the problem. There will be an agreement to make an agreement again. Then, it will be off to the individual countries for ratification, which is expected by March or April. Keep in mind that some of these countries, like Ireland, have to hold referendums. The EU issue will be far from solved this week. Even so, there has been progress with involvement of the IMF, the imposition of more fiscal controls and the expansion of the EFSF. This may by some time by kicking the can down the road to the next deadline. In any case, European stocks opened lower on Friday morning, US stock futures are up slightly and the Euro is slightly lower. Don't forget that the Euro is trading above 1.30 and is virtually unchanged for the year. Sure, it is down from its April high, but it has not collapsed. The Euro would surely be below 1.30 if the Forex market were genuinely nervous about its future.
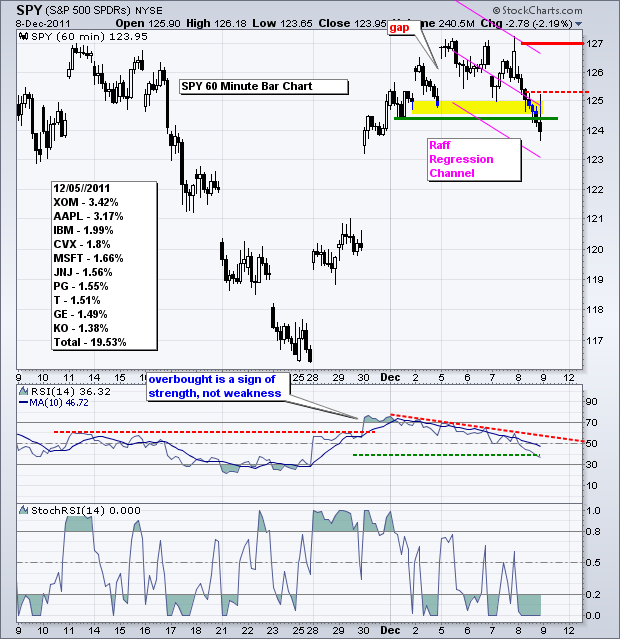
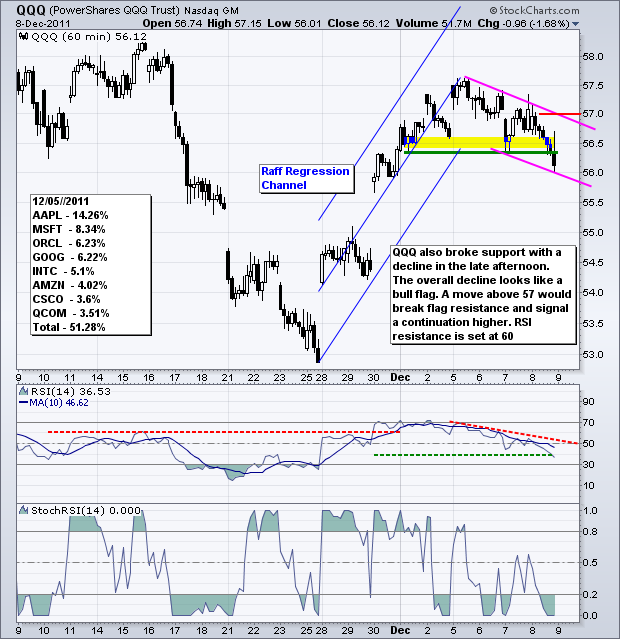
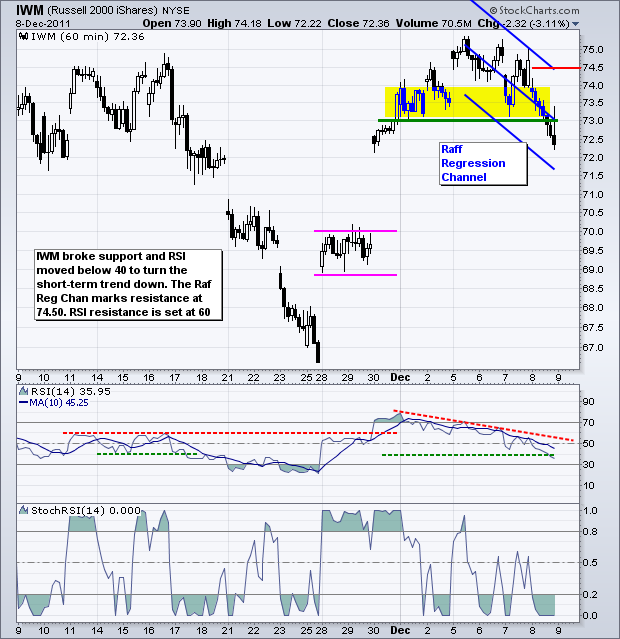
Turning to the major index ETFs, we had breakdowns in IWM, QQQ and SPY on Thursday. USO also broke support, while UUP and TLT broke short-term resistance. GLD followed stocks and the Euro lower on Thursday. The S&P 500 ETF broke below key support and RSI broke below 40. These are short-term bearish developments. Also note that SPY did not follow through on Monday's gap and filled it with the decline over the last two days. At this point, I am going to draw a Raff Regression Channel from this week's closing high to yesterday's closing low. The upper line ends around 126.6 and I am going to mark key resistance at 127. RSI is also trending lower and I am marking resistance at 60. For those with itchy trigger fingers, I am marking a resistance level just above 125. A sharp move back above this level would reverse the support break and could signal a bear trap.
**************************************************************************
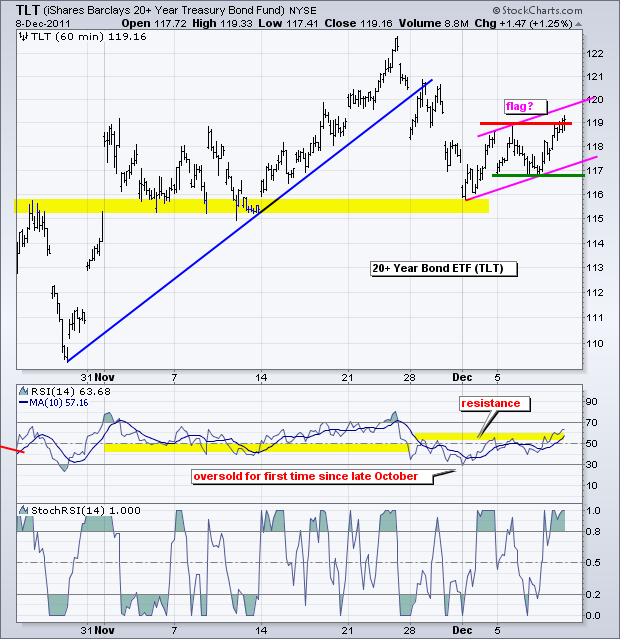
The 20+ year Bond ETF (TLT) broke resistance at 119 as SPY broke support on Thursday afternoon. The December advance could evolve into a bear flag. However, the flag is currently rising and this defines the short-term uptrend. A move below this week's low would break flag support and signal a continuation lower. This would be positive for stocks and the Euro. RSI broke above 60 to turn momentum bullish. Watch support at 40 now.
**************************************************************************
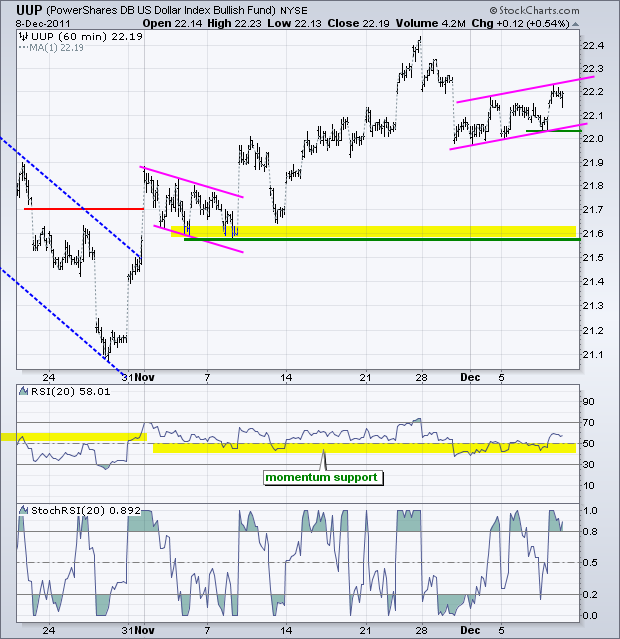
The US Dollar Fund (UUP) continues to edge higher with a rising zigzag over the last 5-6 days. The only problem is that this advance looks like a bear flag. A move below Thursday's low would break flag support and signal a continuation lower. This would target a move to the next support zone around 21.60. RSI held support in the 40-50 zone and edged higher. A break below 40 would turn momentum bearish.
**************************************************************************
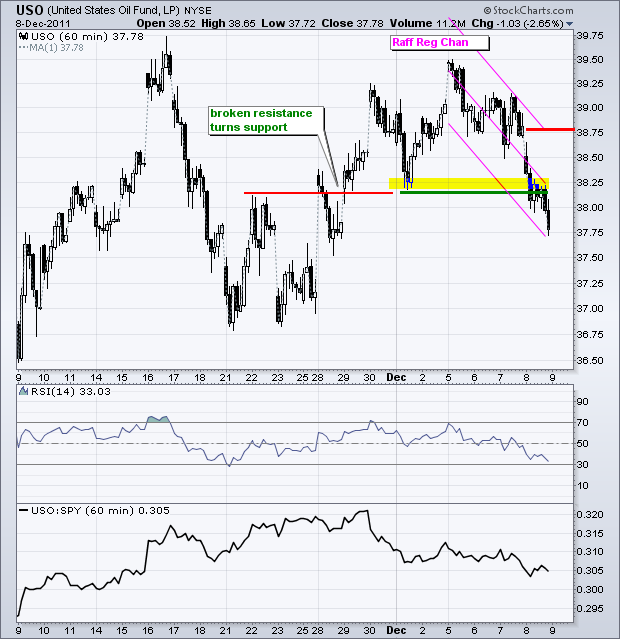
The risk-off trade dominated across the board as the US Oil Fund (USO) broke support with a sharp decline. Also notice that USO formed a lower high and is underperforming the stock market (SPY). USO was outperforming SPY in November. Relative weakness and a support break are bearish. I cannot draw a decent channel with trendlines so I am going to use the Raff Regression Channel for my channel. Key resistance is set at 38.80.
**************************************************************************
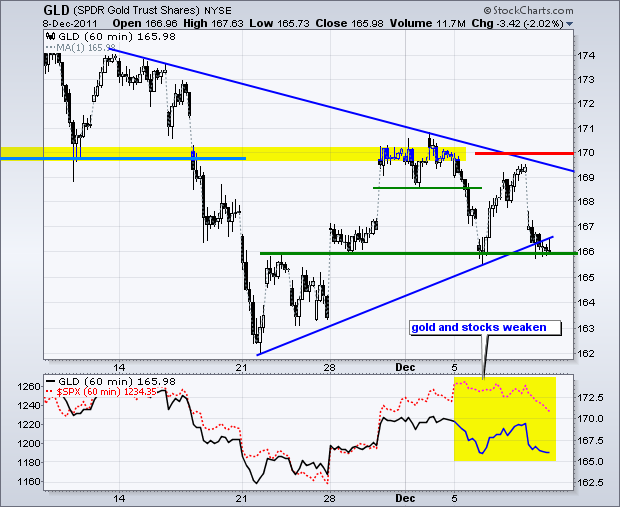
The divorce between gold and stocks proved short as both moved lower over the last few days. For whatever reason, gold is positively correlated to the stock market. GLD is on the verge of breaking support at 166 and this would be a bearish development. Key resistance is now set at 170.
**************************************************************************
Key Economic Reports:
Fri - Dec 09 - 09:55 - Michigan Sentiment
Charts of Interest: Tuesday and Thursday in separate post.
This commentary and charts-of-interest are designed to stimulate thinking. This analysis is not a recommendation to buy, sell, hold or sell short any security (stock ETF or otherwise). We all need to think for ourselves when it comes to trading our own accounts. First, it is the only way to really learn. Second, we are the only ones responsible for our decisions. Think of these charts as food for further analysis. Before making a trade, it is important to have a plan. Plan the trade and trade the plan. Among other things, this includes setting a trigger level, a target area and a stop-loss level. It is also important to plan for three possible price movements: advance, decline or sideways. Have a plan for all three scenarios BEFORE making the trade. Consider possible holding times. And finally, look at overall market conditions and sector/industry performance.


