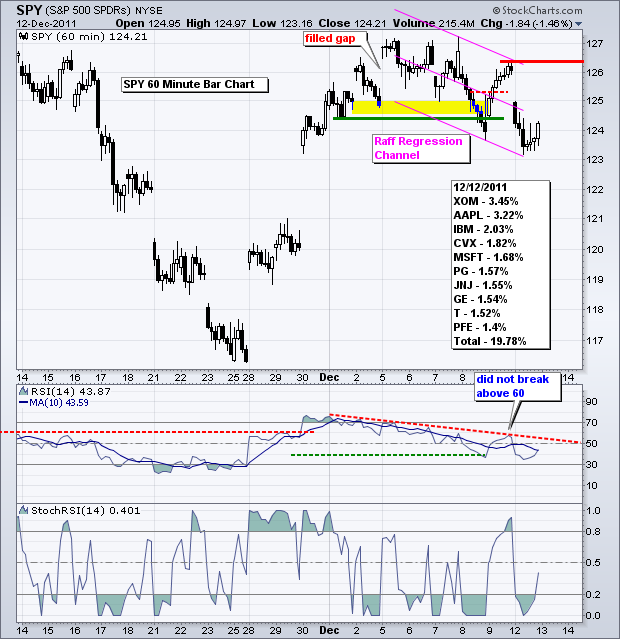
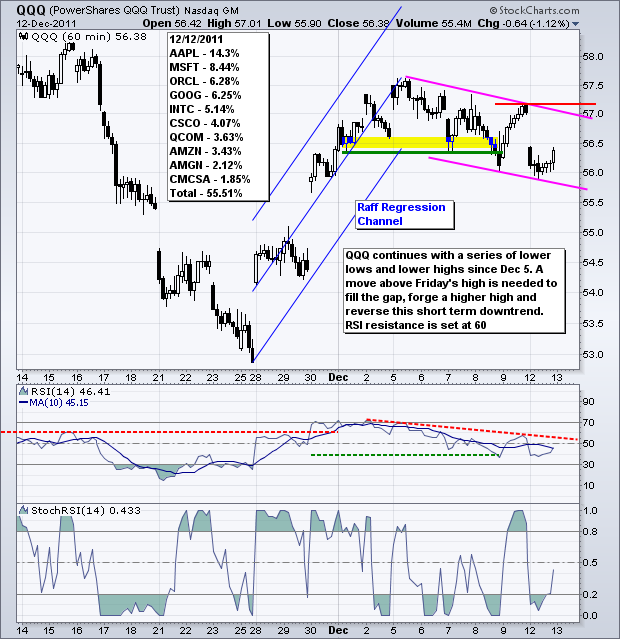
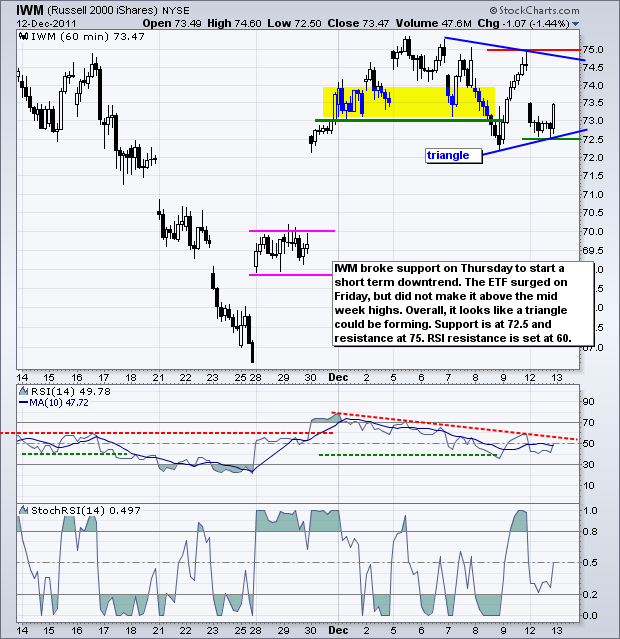
Even though the seasonal patterns are bullish, stocks remain under pressure and the stt trends are down. The bullish seasonals include the two-year cycle, the fourth year of a presidential term, the six-month cycle, the Santa Claus rally, yearend window dressing and the January effect. On the S&P 500 ETF (SPY) chart, the ETF peaked on December 5th and formed a series of lower highs and lower lows the last six days. The most recent low occurred with a gap down and sharp decline on Monday. This gap remains bearish as long as it is unfilled. The Raff Regression Channel marks resistance just above 126. A move above Friday's high would break channel resistance, fill the gap and reverse the short-term downtrend. RSI remains in a short-term downtrend as well with key resistance set at 60.
**************************************************************************
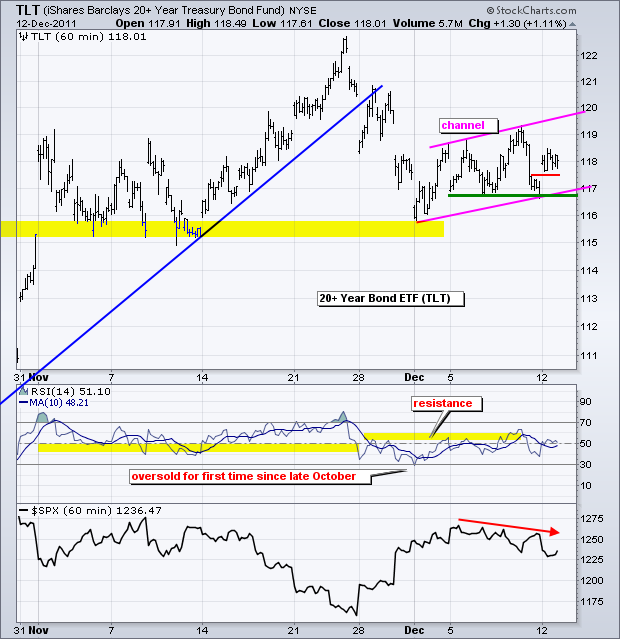
Stocks have been edging lower the last six days and Treasuries have been edging higher. The negative correlation continues. Except for yesterday's gap, the decline in stocks is not that strong. Similarly, the advance in bonds is not so strong either. The 20+ year Bond ETF (TLT) formed a rising channel the last six days. Last week's lows mark key support. After an apparent breakdown on Friday, TLT bounced off the 117 area on Monday. This keeps the slight uptrend alive.
**************************************************************************
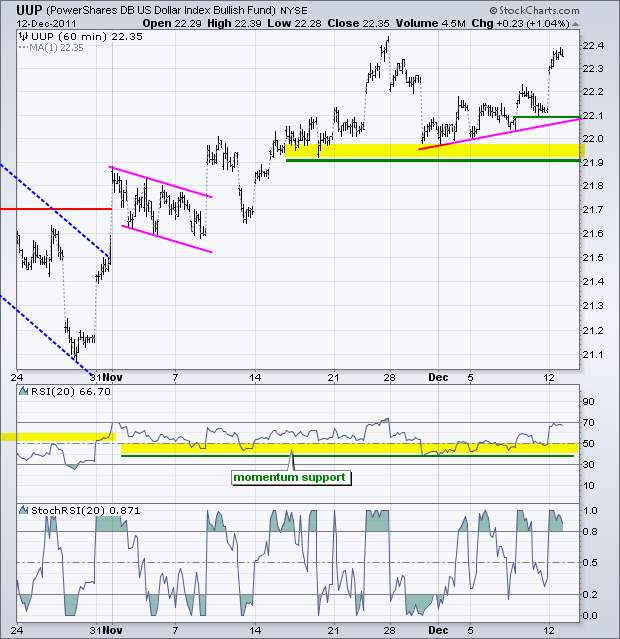
The Euro plunged and the US Dollar Fund (UUP) surged on Monday. Is anyone bullish on the Euro? Even though both currencies have their fundamental problems, the Euro is garnering the bulk of negative attention and the overall trends are down. UUP held support in the 21.9-22 area and surged above 22.30 on Monday. The move reinforces support from the December lows. RSI reinforced support in the 50-60 zone.
**************************************************************************
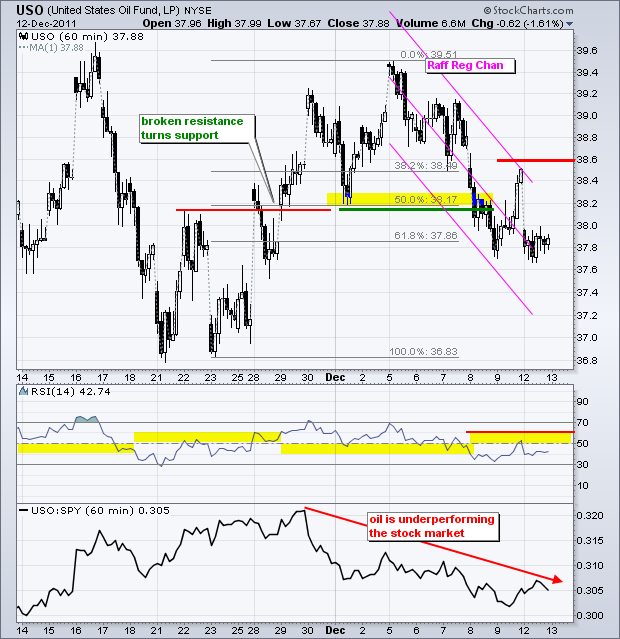
The US Oil Fund (USO) declined along with the stock market and gave up all of Friday's gain. The ETF did manage to stall after the sharply lower open, but remains in a downtrend overall. This is an interesting juncture because USO has retraced 61.80% of the prior advance. Bottom pickers are circling the wagons. As far as the trend, I extended the Raff Regression Channel to yesterday's low and key resistance is set at 38.60. RSI resistance is at 60.
**************************************************************************
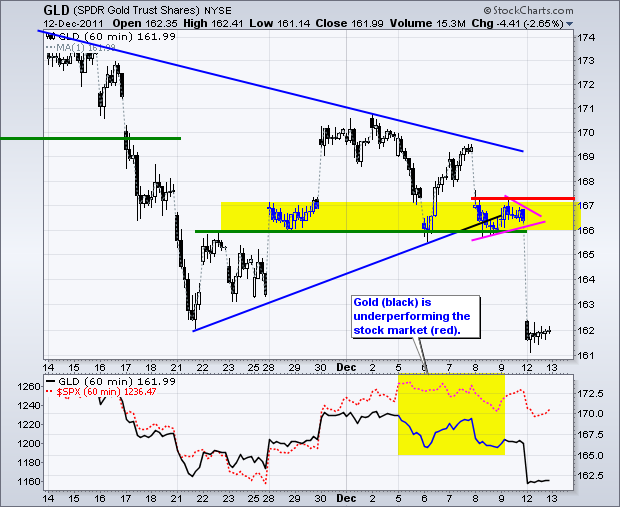
The stock market coughed and gold caught pneumonia. Strength the Dollar also contributed to weakness in gold. The Gold SPDR (GLD) broke pennant support and support from the bigger triangle. The ETF is already short-term oversold, but in a clear downtrend. Broken supports in the 166 area turn into the first resistance zone.
**************************************************************************
Key Economic Reports:
Tue - Dec 13 - 08:30 - Retail Sales
Tue - Dec 13 - 10:00 - Business Inventories
Tue - Dec 13 - 14:15 - FOMC Policy Statement
Wed - Dec 14 - 07:00 - MBA Mortgage Index
Wed - Dec 14 - 10:30 - Oil Inventories
Thu - Dec 15 - 08:30 - Jobless Claims
Thu - Dec 15 - 08:30 - PPI
Thu - Dec 15 - 08:30 - Empire State Manufacturing
Thu - Dec 15 - 09:15 - Industrial Production
Thu - Dec 15 - 10:00 - Philadelphia Fed Report
Fri - Dec 16 - 08:30 – Consumer Price Index (CPI)
Charts of Interest: Tuesday and Thursday in separate post.
This commentary and charts-of-interest are designed to stimulate thinking. This analysis is not a recommendation to buy, sell, hold or sell short any security (stock ETF or otherwise). We all need to think for ourselves when it comes to trading our own accounts. First, it is the only way to really learn. Second, we are the only ones responsible for our decisions. Think of these charts as food for further analysis. Before making a trade, it is important to have a plan. Plan the trade and trade the plan. Among other things, this includes setting a trigger level, a target area and a stop-loss level. It is also important to plan for three possible price movements: advance, decline or sideways. Have a plan for all three scenarios BEFORE making the trade. Consider possible holding times. And finally, look at overall market conditions and sector/industry performance.

