It looks like we had some sell-the-rumor and buy-the-news. Rumors of an EU breakdown were swirling on Thursday and this caused a sell-off in stocks. However, these rumors were squashed with an agreement to agree on fiscal constraints. Admittedly, we did not get a concrete agreement out of the EU summit, but there was some, albeit little, progress. The real work still lies ahead. Debt is debt. It doesn't just disappear. Governments must either print money to dilute the debt (US style) or pay the debt. The European Central Bank (ECB) is not printing money yet so the debt overhang remains. Moreover, an OECD report is expected to warn that funding requirements for 2012 will strain global bond markets. But 2012 is still a long ways off! We still have yearend window dressing, the Santa Claus rally and the build up to the January effect. This means we could see some sort of yearend strength as money moves into the asset that has been performing quite well since early October. That asset would be the US stock market.
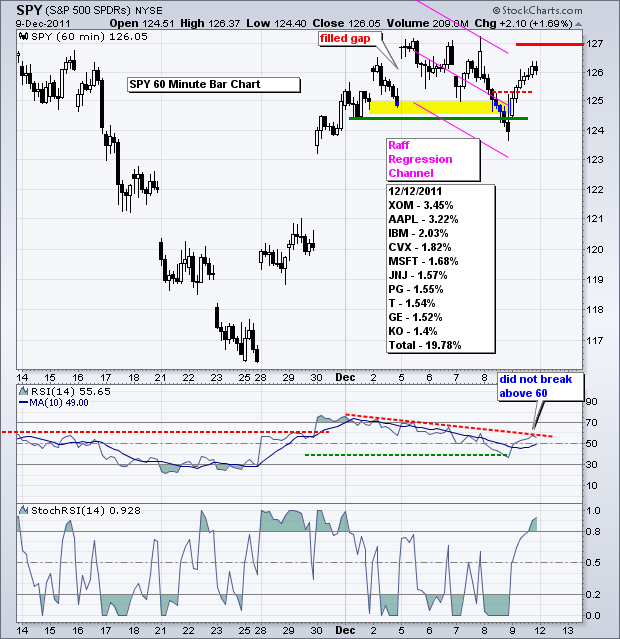
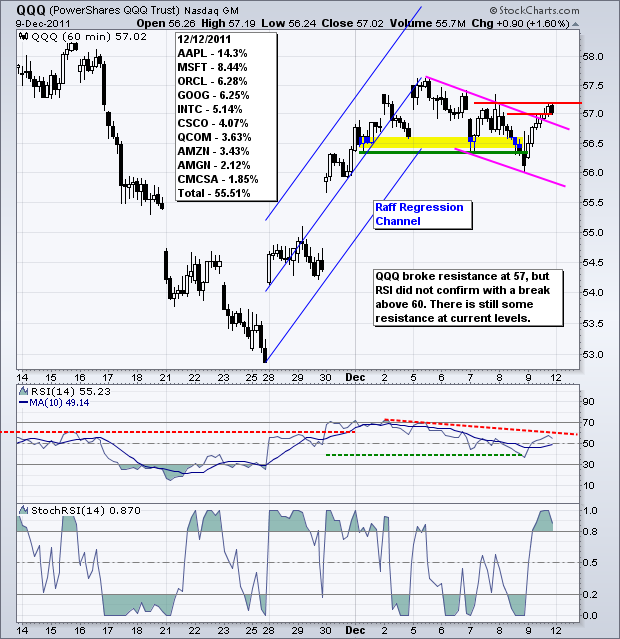
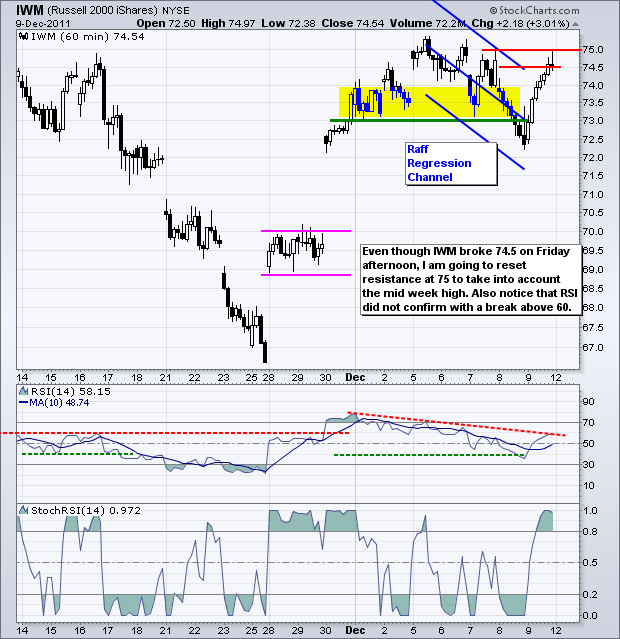
Despite some positive seasonal patterns ahead, we should watch the charts for concrete clues. After breaking short-term support levels on Thursday, IWM, QQQ and SPY quickly rebounded on Friday and surged throughout the day. Buying pressure remained as stocks closed strong. IWM and QQQ broke channel resistance, but are still in resistance zones from the highs last Wednesday-Thursday. SPY fell short of a breakout and remains in a short-term downtrend. The bulls have yet to take full control of the short-term trend. SPY surged above 125.4 to trigger a bear trap. This was the first resistance level set on Friday morning. Despite Friday's surge, SPY remains with a series of lower highs and lower lows the last five days. Notice that the ETF has been working its way lower since the big gap last Monday. There is a lot of resistance in the 126-127 area. A break above 127 in SPY and 60 in RSI is needed to fully reverse the downtrend. Note that we have a big week on the economic front. Retail Sales are due Tuesday, the Fed makes its policy statement on Wednesday, and Industrial Production and Empire Manufacturing are on Thursday. I think Retail Sales is the biggie here.
**************************************************************************
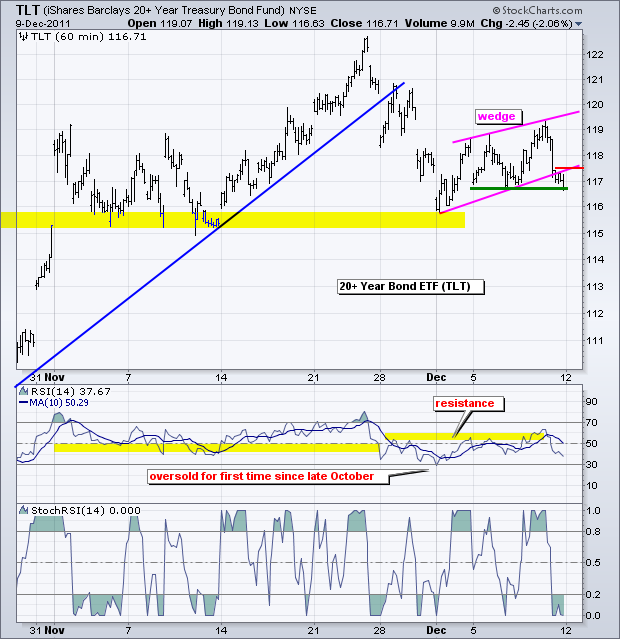
The 20+ year Bond ETF (TLT) will likely move counter to the stock market and the Euro, as it did on Friday. TLT broke the wedge trendline and finished the day right at its mid week low, which marks support. TLT is on the verge of a breakdown, just as stocks are on the verge of a breakout. A swift move back above 117.5 would argue for a bear trap of sorts.
**************************************************************************
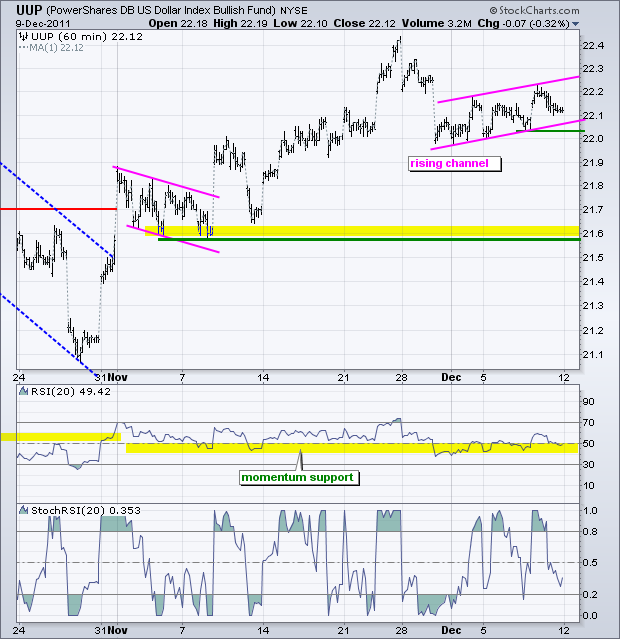
Despite the big love-in at the EU summit, the Euro did not surge that much. The US Dollar Fund (UUP) remains within a rising channel over the last eight days. Even though this could be a rising flag, the bulls still get the benefit of the doubt as long as the channel rises. A move below Wednesday's low (call it 22) would break support and reverse this uptrend. RSI held the support zone and momentum remains bullish.
**************************************************************************
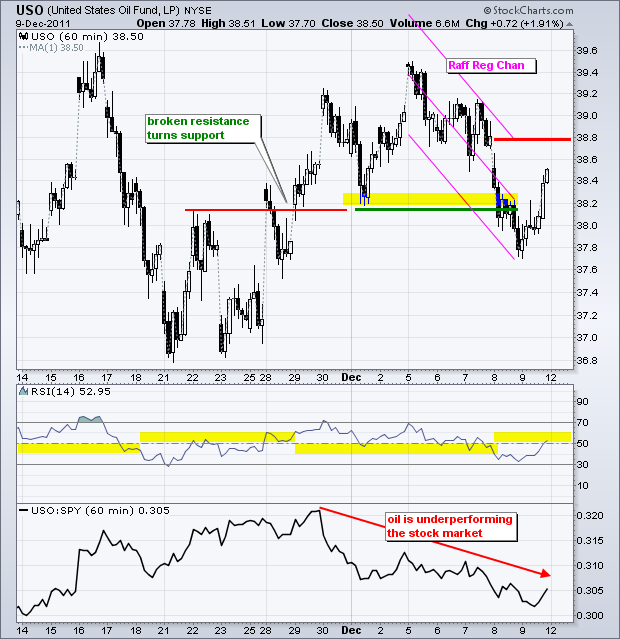
The US Oil Fund (USO) surged along with the stock market on Friday, but this looks like an oversold bounce within a downtrend. Key resistance remains at 38.80, which is still 25 cents away. RSI moved into its resistance zone in the 50-60 area and momentum remains bearish overall. Chartists should also note that oil has been underperforming the stock market since late November. This is a negative for both because falling oil prices suggest weakening demand due to a slow economy.
**************************************************************************
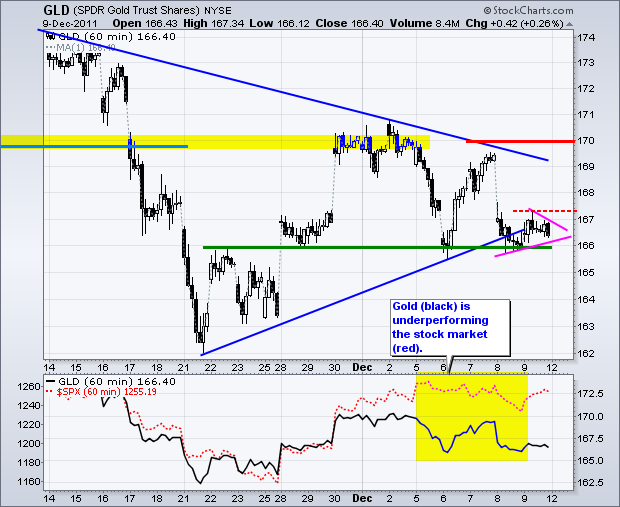
Stocks surged and Euro bounced, the Gold SPDR (GLD) sputtered and did not perform well on Friday. The ETF plunged to support on Thursday and consolidated the last two days. This looks like a pennant of sorts and a break below 166 would signal a continuation lower. The next support zone resides around 162-163. Gold and stocks remain positively correlated. This means any weakness in the stock market could push gold over the edge.
**************************************************************************
Key Economic Reports:
Tue - Dec 13 - 08:30 - Retail Sales
Tue - Dec 13 - 10:00 - Business Inventories
Tue - Dec 13 - 14:15 - FOMC Policy Statement
Wed - Dec 14 - 07:00 - MBA Mortgage Index
Wed - Dec 14 - 10:30 - Oil Inventories
Thu - Dec 15 - 08:30 - Jobless Claims
Thu - Dec 15 - 08:30 - PPI
Thu - Dec 15 - 08:30 - Empire State Manufacturing
Thu - Dec 15 - 09:15 - Industrial Production
Thu - Dec 15 - 10:00 - Philadelphia Fed Report
Fri - Dec 16 - 08:30 – Consumer Price Index (CPI)
Charts of Interest: Tuesday and Thursday in separate post.
This commentary and charts-of-interest are designed to stimulate thinking. This analysis is not a recommendation to buy, sell, hold or sell short any security (stock ETF or otherwise). We all need to think for ourselves when it comes to trading our own accounts. First, it is the only way to really learn. Second, we are the only ones responsible for our decisions. Think of these charts as food for further analysis. Before making a trade, it is important to have a plan. Plan the trade and trade the plan. Among other things, this includes setting a trigger level, a target area and a stop-loss level. It is also important to plan for three possible price movements: advance, decline or sideways. Have a plan for all three scenarios BEFORE making the trade. Consider possible holding times. And finally, look at overall market conditions and sector/industry performance.

