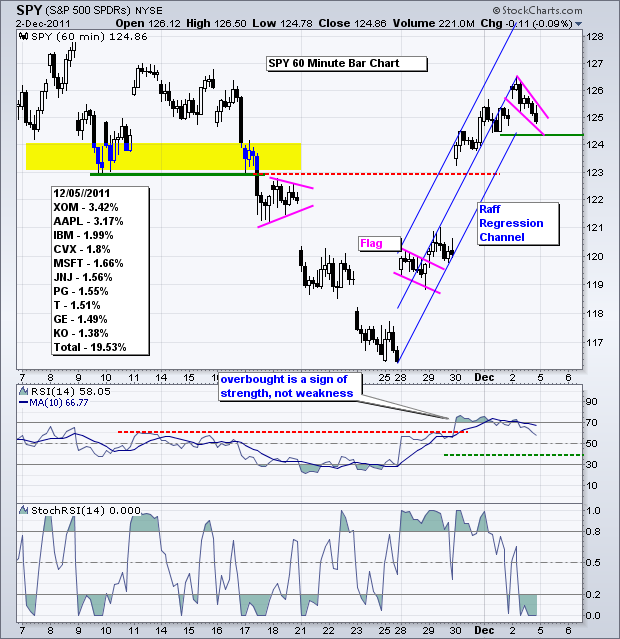
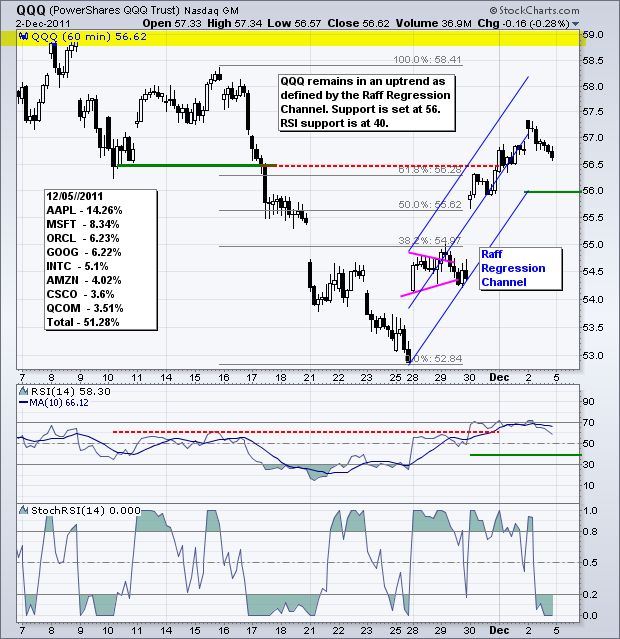
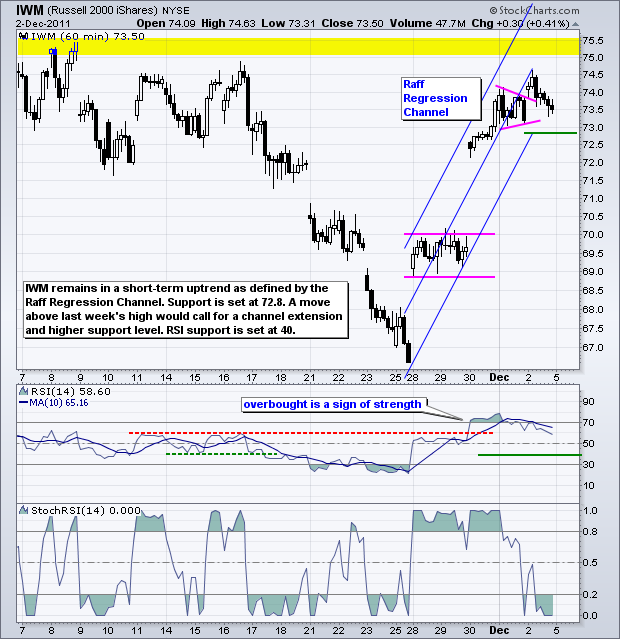
That was one heck of a rally last week. SPY and QQQ surged over 7% and IWM was up over 10%. Was last week's surge an August-September surge or an October surge? A 7% surge in SPY compares to the beginning of October, which preceded a huge advance. However, also note that SPY surged 7% four times from August 8th until September 26th. Each of these surges fizzled soon after exceeding the 7% mark and SPY declined over 7% afterwards. At this point, I will treat the current surge as an October surge, which means there is more to come. Note that SPY ultimately surged 18.5% in October. Also note that there were never more than two consecutive down days in October. On the 60-minute SPY chart, I am using the Raff Regression Channel to define the trend and mark support at 124.20. SPY gapped up again on Friday and then corrected with a small falling wedge, A break above wedge resistance would signal yet another continuation higher with an upside target around 128-129, the late October highs.
**************************************************************************
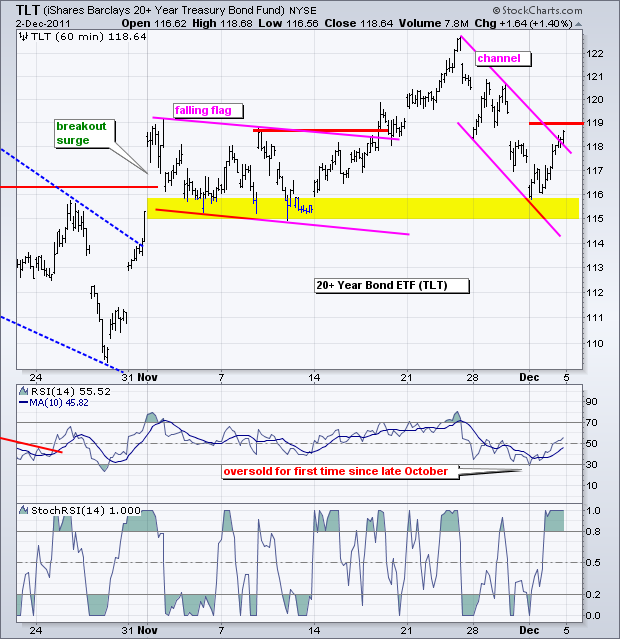
Treasuries did not consider the employment report positive because the 20+ year Bond ETF (TLT) advanced over 1% on the news. A truly strong employment report and stock market rally would have produced a sell off in Treasuries. TLT rallied above the channel trendline, but has yet to break resistance at 119. Follow through above this level would reverse the six-day downtrend.
**************************************************************************
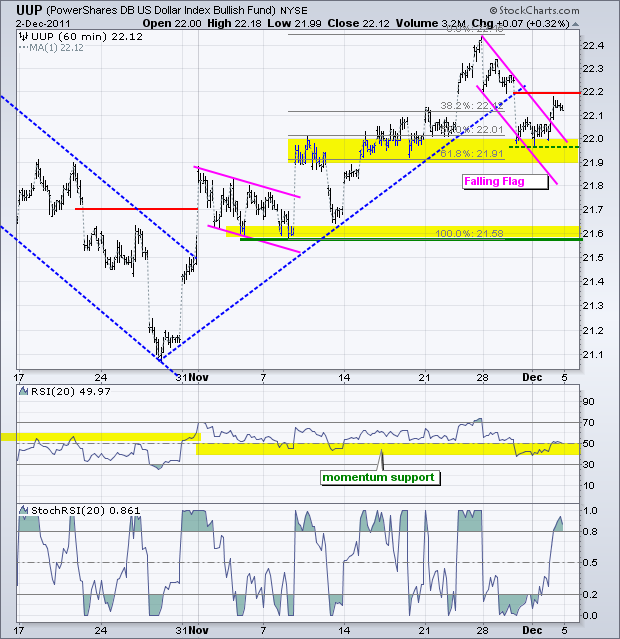
The US Dollar Fund (UUP) broke flag resistance with a surge on Friday, but stalled below my resistance level set at 22.20. The Euro takes center stage again this week. I almost have to laugh when reading the headlines this morning. Yes, it is another crucial week with another critical summit of EU leaders. When was the last time we had a non-critical week. The European Central Bank (ECB) also makes is rate decision on Thursday. Turning back to the chart, a move above 22.20 would break resistance and argue for higher prices. A move below last week's low would be bearish and argue for a deeper correction towards the 21.6-21.7 area.
**************************************************************************
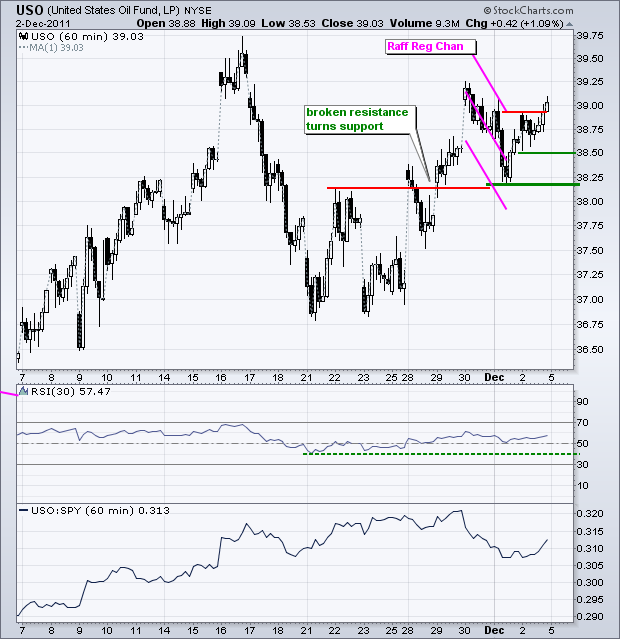
The US Oil Fund (USO) broke resistance in the 38.15 area and this zone turns into key support. There was a throwback to this level early last week. The bounce last Tuesday affirms support there. USO went on to break resistance from the Raff Regression Channel. This signals a continuation of the overall uptrend.
**************************************************************************
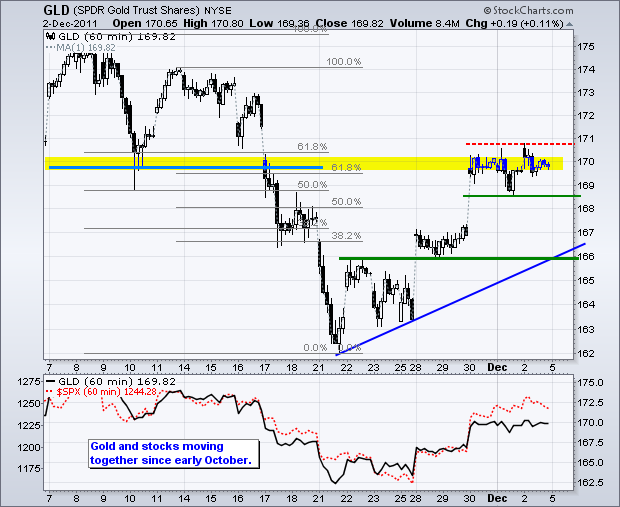
The Gold SPDR (GLD) surged to resistance around 170 and then consolidated the last few days. There was a dip to 168.50 that established first support. Also note that a small inverse Head-and-Shoulders pattern could be forming the last few days. A move above 171 would break resistance and argue for a continuation higher. Keep an eye on stocks because gold is positively correlated with SPY at the moment.
**************************************************************************
Key Economic Reports:
Mon - Dec 05 - 10:00 - Factory Orders
Mon - Dec 05 - 10:00 - ISM Services
Wed - Dec 07 - 07:00 - MBA Mortgage Index
Wed - Dec 07 - 10:30 - Crude Inventories
Wed - Dec 07 - 15:00 - Consumer Credit
Thu - Dec 08 - 08:30 - Initial Claims
Thu - Dec 08 - 08:30 – ECB Policy Statement
Thu - Dec 08 - 10:00 - Wholesale Inventories
Fri - Dec 09 - 09:55 - Michigan Sentiment
Charts of Interest: Tuesday and Thursday in separate post.
This commentary and charts-of-interest are designed to stimulate thinking. This analysis is not a recommendation to buy, sell, hold or sell short any security (stock ETF or otherwise). We all need to think for ourselves when it comes to trading our own accounts. First, it is the only way to really learn. Second, we are the only ones responsible for our decisions. Think of these charts as food for further analysis. Before making a trade, it is important to have a plan. Plan the trade and trade the plan. Among other things, this includes setting a trigger level, a target area and a stop-loss level. It is also important to plan for three possible price movements: advance, decline or sideways. Have a plan for all three scenarios BEFORE making the trade. Consider possible holding times. And finally, look at overall market conditions and sector/industry performance.

