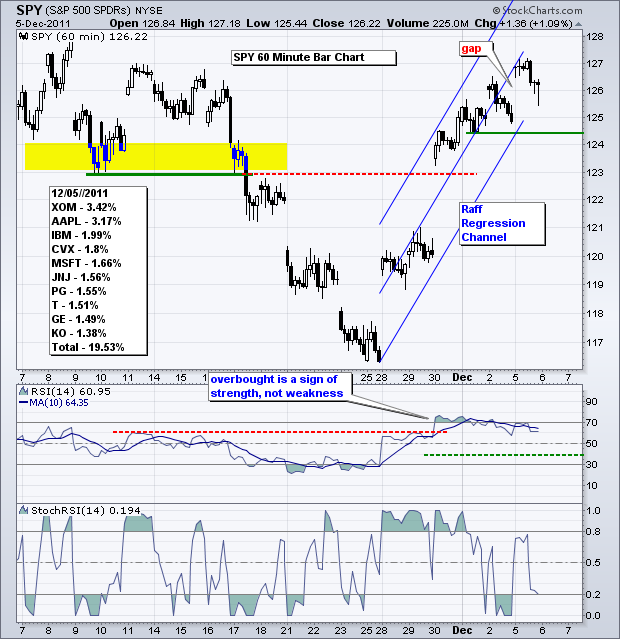
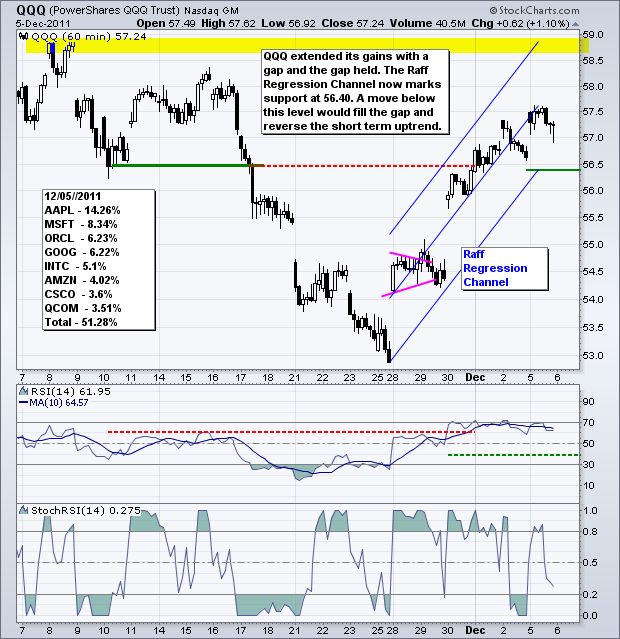
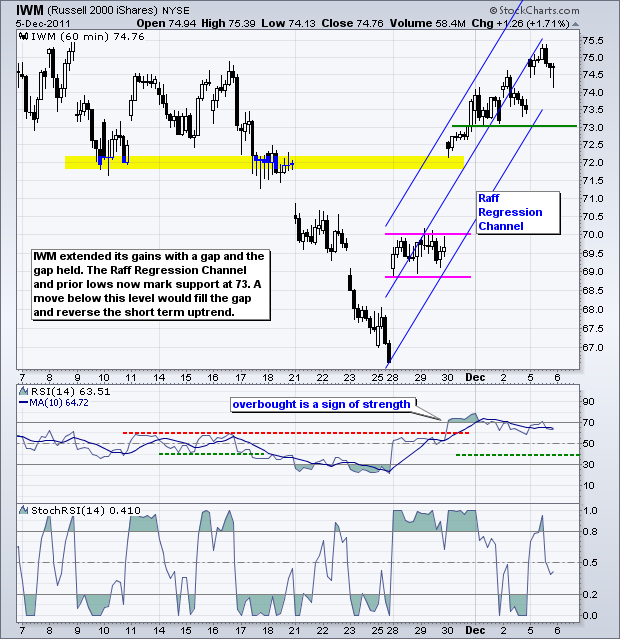
This could be the week that breaks the bear's back or triggers a sharp reversal at resistance. While US ties to Europe are relatively small as a percentage of GDP, Europe's influence on the stock market and Dollar has been relatively large. Today's headlines indicate that France and Germany have issued an ultimatum to Euro zone members: accept more central control over fiscal policies or prepare for the unthinkable. On the positive side, Merkel and Sarkozy are united and Italy's prime minister is serious about tackling its problems. There is also a new ECB President who may show greater flexibility on Thursday. On the negative side, Merkel and Sarkozy want acceptance of this ultimatum within a week. Of course, the end of the week in European terms means the end of March! Yes, Sarkozy then went on to say that they hoped to reach a consensus for changing the Euro zone treaty by March. Oh yeah, and these treaty changes then need to be ratified by the parliaments in each country. The long slog continues with no clear end in sight. We really need to take it one-day or one-week at a time. A general acceptance of the ultimatum this week and help from the ECB would likely boost the stock market. Failure on one or both accounts could be a blow. This blow could be especially hard because US stocks are trading 8-10% above their late November lows and 15-20% above their October lows. While there is plenty of room to fall and the potential for bearish news, there is also plenty of room to rise and the potential for bullish news. Most major indices are trading just above the mid points of their six month ranges. The summer highs mark the upper end of this range, while the autumn lows mark the low end. Steelers Wheel is going around in mind head now: "There I am, stuck in the middle with you". The market could go either way, but the current trend is up and has yet to reverse On the SPY chart, the ETF remains in an uptrend as defined by the steep Raff Regression Channel. I am marking support at 124.40 for a little buffer. A move below this level would fill Monday's gap and reverse the short-term uptrend.
**************************************************************************
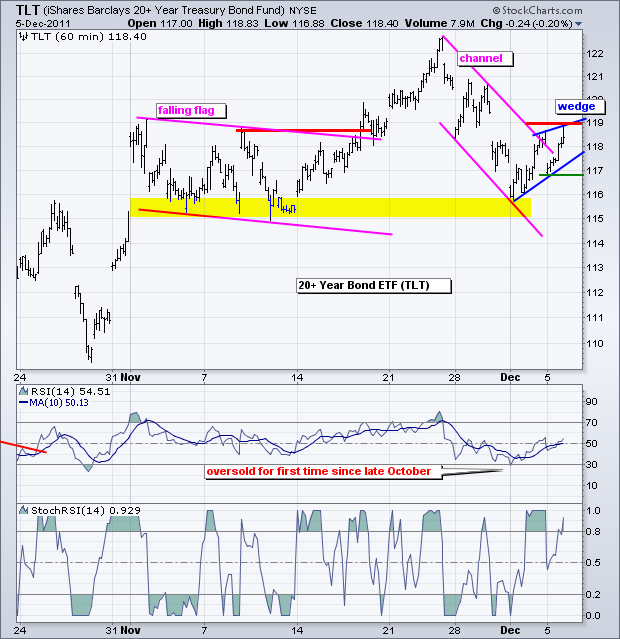
The 20+ year Bond ETF (TLT) is at a make-or-break point. After plunging to 116 last week, the ETF rebounded back above 118 the last few days. This bounce met resistance at 119 as a rising wedge formed. A move below yesterday's low would break wedge support and signal a continuation lower. This would be positive for stocks. Also note that RSI became oversold last week and bounced to the 50-60 zone, which could offer resistance. On the bull side, look for TLT to break 119 and RSI to break 60.
**************************************************************************
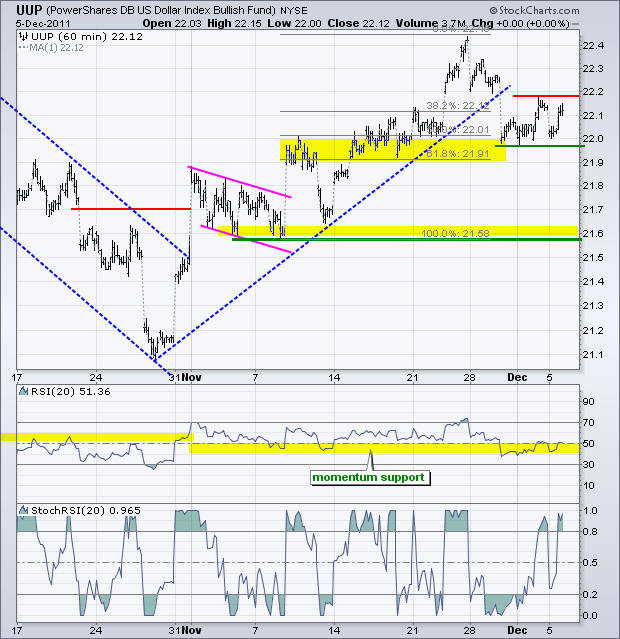
The US Dollar Fund (UUP) is also at a make-or-break area. Note that Treasuries and the Dollar have been positively correlated since early September. Both are rising and falling together. This correlation has been exceptionally strong as well. The 20-day UUP-SPY Correlation Coefficient on the daily chart has been above .75 since September 12th. On the price chart, UUP fell to 22 and then consolidated the past week. Watch resistance at 22.20 for a breakout and support at 21.95 for a support break.
**************************************************************************
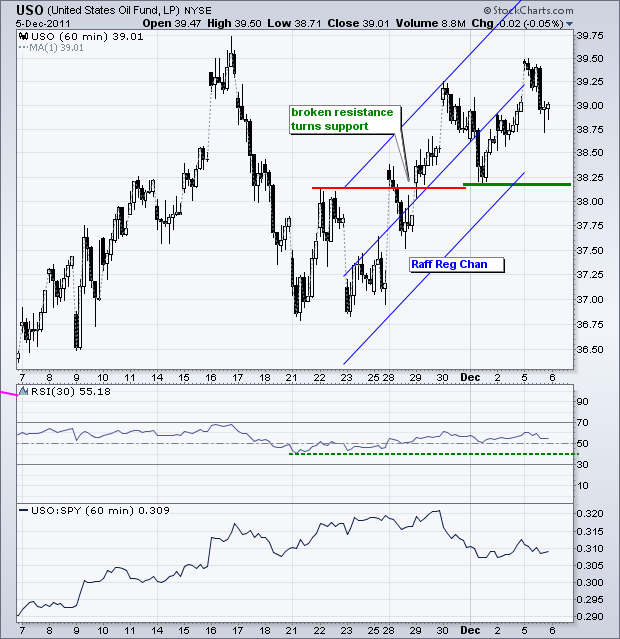
The US Oil Fund (USO) continues to work its way higher with a rising zigzag since November 23rd. Broken resistance turned into support in the 38.25 area. The end of the Raff Regression Channel confirms support here. A move below the early December low would break this support zone and reverse the short-term uptrend. Oil and stocks have been positively correlated this year so keep an eye on stocks for clues on energy demand.
**************************************************************************
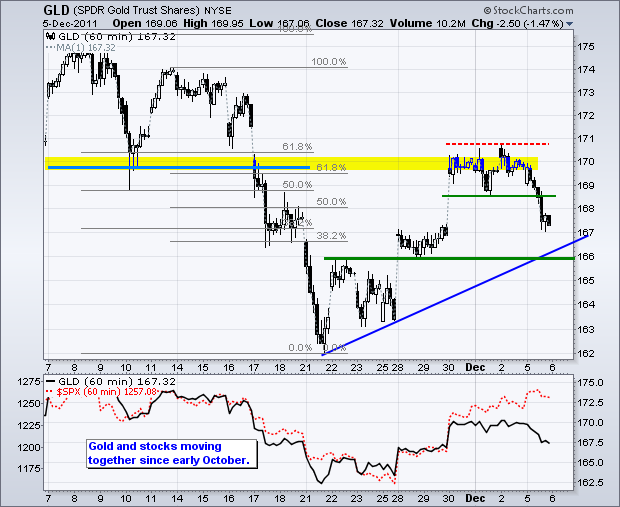
The Gold SPDR (GLD) divorced itself from the stock market on Monday as gold fell in the face of stock market strength. Moreover, GLD fell rather hard. Perhaps gold's safe-haven status wore off with high hopes for Europe. On the price chart, GLD broke first support with a sharp decline. Key support remains at 166. I would also suggest that there is a support zone in the 166-167 area from the late November trendline and consolidation. A big test is in the making for gold.
**************************************************************************
Key Economic Reports:
Wed - Dec 07 - 07:00 - MBA Mortgage Index
Wed - Dec 07 - 10:30 - Crude Inventories
Wed - Dec 07 - 15:00 - Consumer Credit
Thu - Dec 08 - 08:30 - Initial Claims
Thu - Dec 08 - 08:30 – ECB Policy Statement
Thu - Dec 08 - 10:00 - Wholesale Inventories
Fri - Dec 09 - 09:55 - Michigan Sentiment
Charts of Interest: Tuesday and Thursday in separate post.
This commentary and charts-of-interest are designed to stimulate thinking. This analysis is not a recommendation to buy, sell, hold or sell short any security (stock ETF or otherwise). We all need to think for ourselves when it comes to trading our own accounts. First, it is the only way to really learn. Second, we are the only ones responsible for our decisions. Think of these charts as food for further analysis. Before making a trade, it is important to have a plan. Plan the trade and trade the plan. Among other things, this includes setting a trigger level, a target area and a stop-loss level. It is also important to plan for three possible price movements: advance, decline or sideways. Have a plan for all three scenarios BEFORE making the trade. Consider possible holding times. And finally, look at overall market conditions and sector/industry performance.


