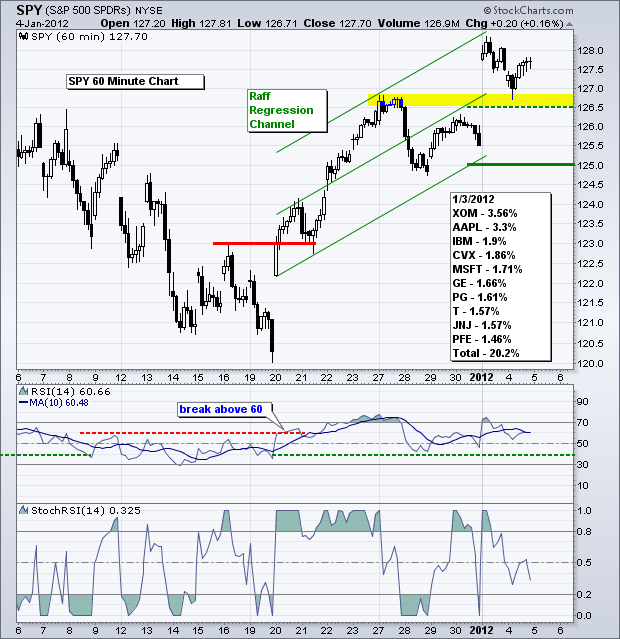
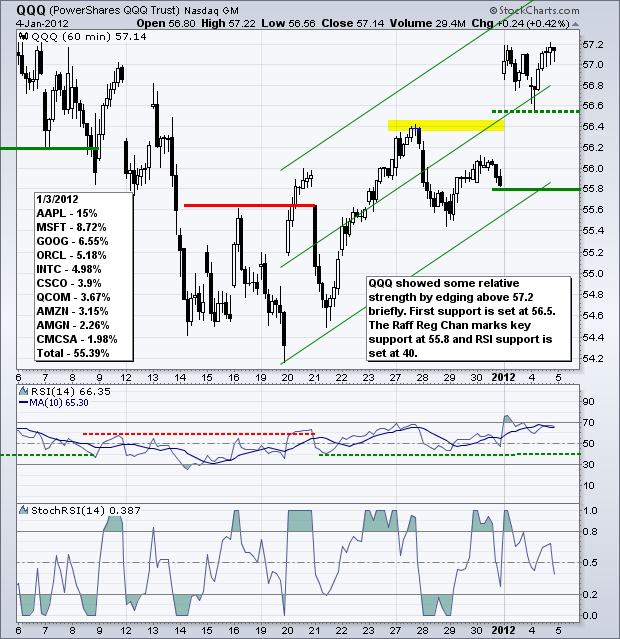
The S&P 500 ETF (SPY) remains in a short-term uptrend on the 60-minute chart. After a big gap on Tuesday morning, the ETF pulled back to broken resistance, which turned into the first support zone in the 126.50 area. SPY bounced back above 127.5 yesterday afternoon and first support is now set at 126.50. A move below this level and an RSI break below 40 would provide the first signs of trend reversal. For now, I am going to leave key support at 125 because volatility could be high the next two days. Based on the Raff Regression Channel, this KEY support level is designed to identify a trend change upon its break. We could see some fireworks today with the ISM Services Index, ADP Employment Report and French bond auction. After the close today, traders will be at the mercy of Friday's employment report.
**************************************************************************
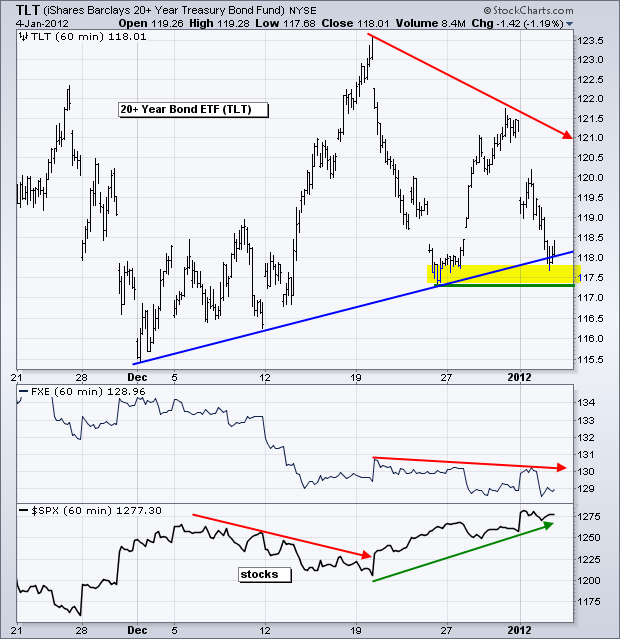
The moment-of-truth is nigh for the Treasury Market. Strong economic reports weighed on Treasuries recently and the market is bracing for two more days of key reports. It is also interesting to note that Treasuries are falling along with the Euro the last two weeks. The Treasury market is more fixated on the Fed and the US economy than the Euro and the Euro-debt crisis. On the price chart, the 20+ Year T-Bond ETF (TLT) is at a key support level now. A break would be bearish for TLT and bullish for the stock market. Don't forget that Treasuries and stocks are negatively correlated.
**************************************************************************
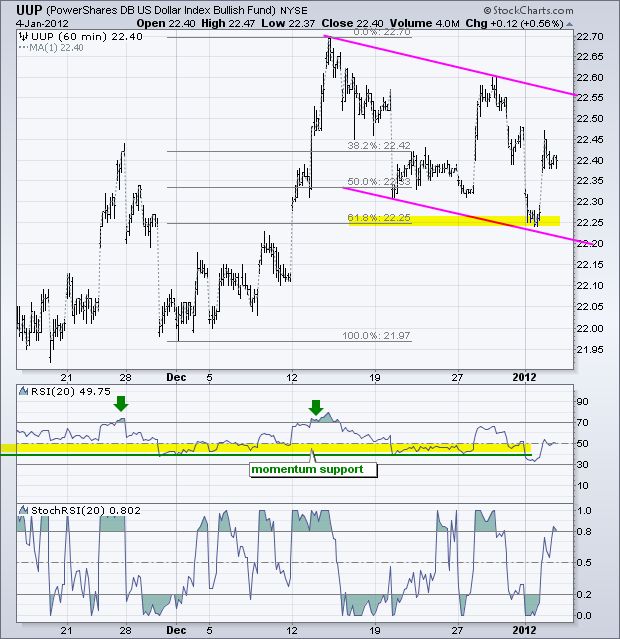
The US Dollar Fund (UUP) surged off the 61.80% retracement with a move above 22.40 in early trading on Wednesday. The overall trend is down since mid December, but this pattern looks like a big flag, which is a bullish continuation pattern. Wednesday's surge is the first start to a breakout. A move above the upper trendline and last week's high would complete the reversal and signal a continuation of the early December surge.
**************************************************************************
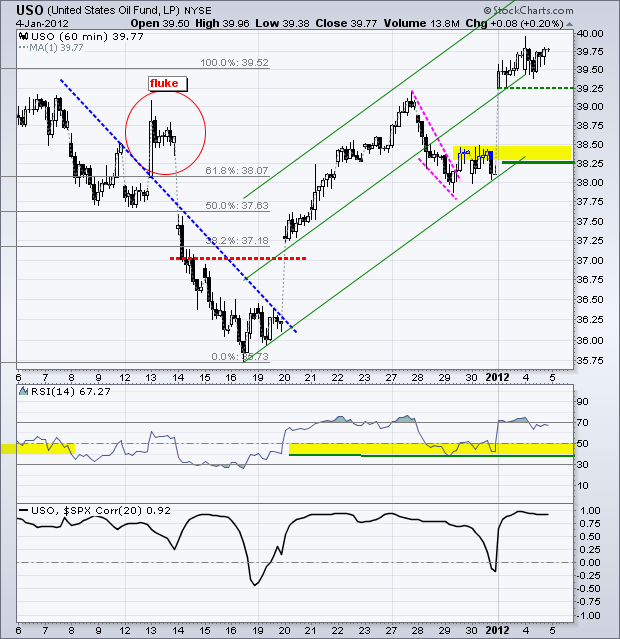
The US Oil Fund (USO) remains in an uptrend and positively correlated with the stock market. The bottom indicator window shows the Correlation Coefficient (USO,$SPX) in positive territory for most of the past month. With a consolidation the last two days, the ETF has first support at 39.25. The Raff Regression Channel and broken resistance mark key support in the 38.25-38.50 area. RSI support is set at 40.
**************************************************************************
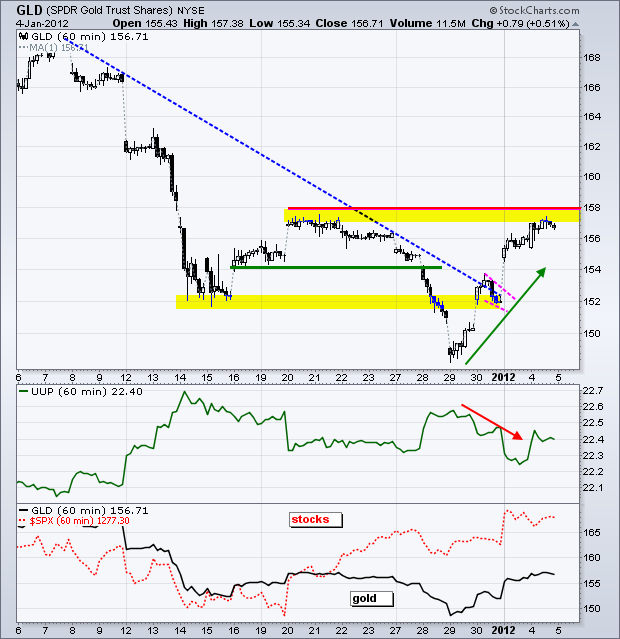
Weakness in the Dollar and strength in the stock market pushed the Gold SPDR (GLD) to resistance early this year. This dynamic may be under threat as the Euro weakened on Wednesday and continued lower in early trading on Thursday. Stocks held up on Wednesday, but stock futures are under pressure early Thursday. Weakness in the Euro and stock market, combined with short-term overbought conditions and resistance, could weigh on gold in the coming days.
**************************************************************************
Key Economic Reports:
Thu - Jan 05 - 07:30 - Challenger Job Cuts
Thu - Jan 05 - 08:15 - ADP Employment Report
Thu - Jan 05 - 08:30 - Jobless Claims
Thu - Jan 05 - 10:00 - ISM Services Index
Thu - Jan 05 - 11:00 - Oil Inventories
Fri - Jan 06 - 08:30 - Employment Report
Charts of Interest: Tuesday and Thursday in separate post.
This commentary and charts-of-interest are designed to stimulate thinking. This analysis is not a recommendation to buy, sell, hold or sell short any security (stock ETF or otherwise). We all need to think for ourselves when it comes to trading our own accounts. First, it is the only way to really learn. Second, we are the only ones responsible for our decisions. Think of these charts as food for further analysis. Before making a trade, it is important to have a plan. Plan the trade and trade the plan. Among other things, this includes setting a trigger level, a target area and a stop-loss level. It is also important to plan for three possible price movements: advance, decline or sideways. Have a plan for all three scenarios BEFORE making the trade. Consider possible holding times. And finally, look at overall market conditions and sector/industry performance.

