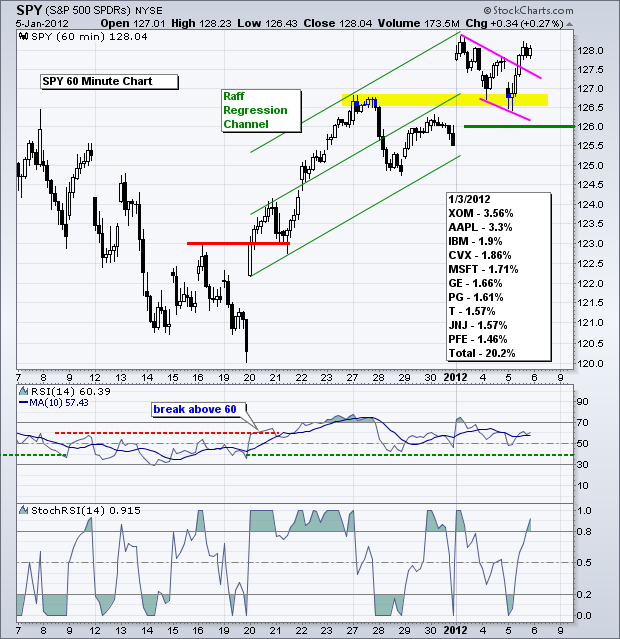
The S&P 500 ETF (SPY) gapped up on Tuesday morning, formed a falling flag the next 2-3 days and then broke flag resistance with yesterday's surge. The short-term trend has been up since the breakout on December 20th and the bulls remain in charge. Notice how the ETF opened weak on Thursday, but held support in the 126.5 area and surged above flag resistance. This move reinforces support in the 126.50 area. As such, I am raising key support at 126 on the 60-minute chart. RSI support remains at 40. It is positive to note that SPY surged despite a sharp decline in the Euro. I think Thursday's weakness in the Euro was more a function of Dollar strength. Continuing strength in US economic reports is putting upward pressure on US interest rates, which makes the Dollar more attractive as a currency. Focus will return to the Euro next week as Spain and Italy raise money in the bond market.
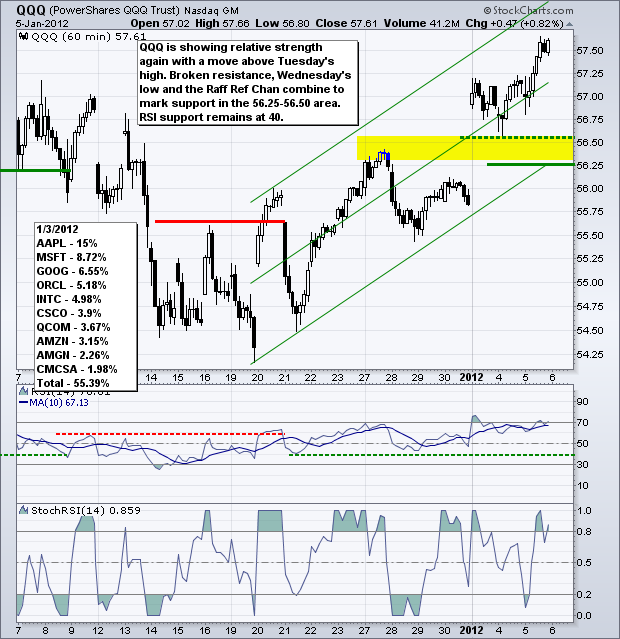
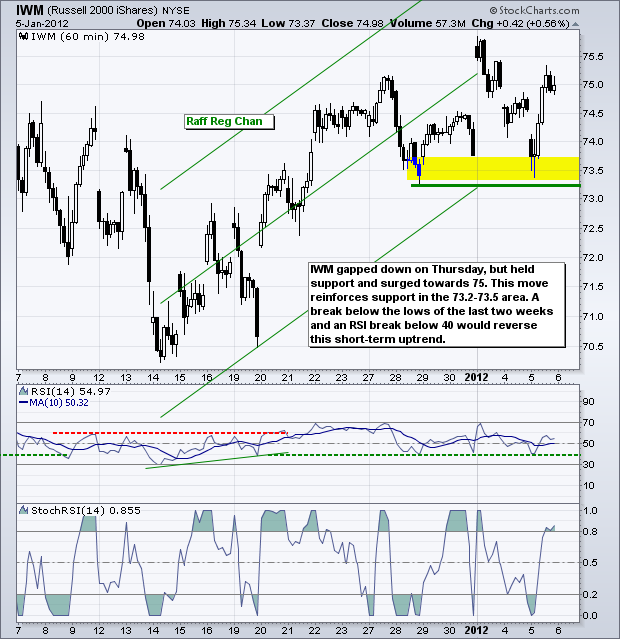
**************************************************************************
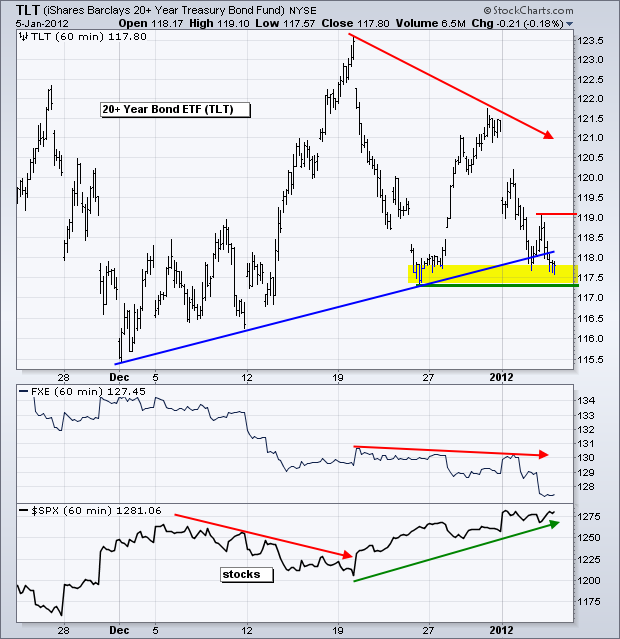
Treasuries were pulled both ways by Thursday's events. Strength in stocks and a better-than-expected ADP Employment Report put downward pressure on Treasuries, while the plunge in the Euro was bullish. As a result, the 20+ Year T-Bond ETF (TLT) tested support with a modest decline on Thursday. Today's employment report will make or break this support level. A breakdown in TLT would be bullish for stocks, while a successful support test and surge above 119.1 would be bearish for stocks.
**************************************************************************
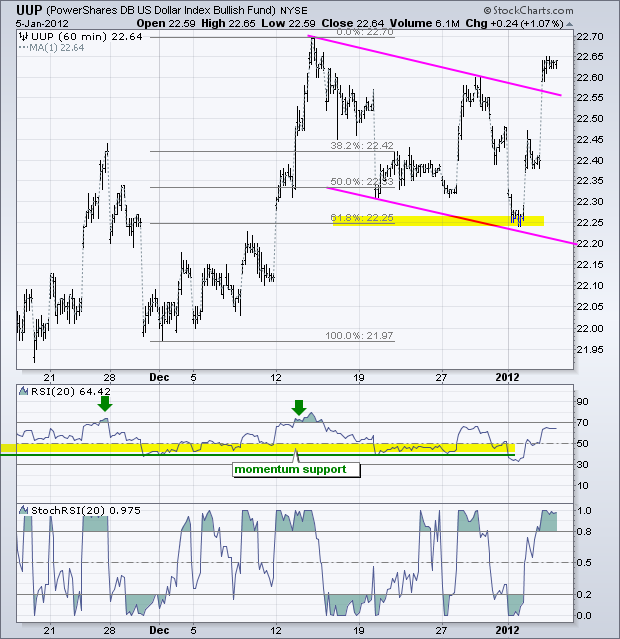
The US Dollar Fund (UUP) extended its gains with a break above flag resistance and a new high for the year (all three trading days). This breakout signals a continuation of the early December surge and targets a move to the 23 area. The prior move (22.7 – 22 = .70) is added to the flag low for a target (22.25 + .70 = 22.95).
**************************************************************************
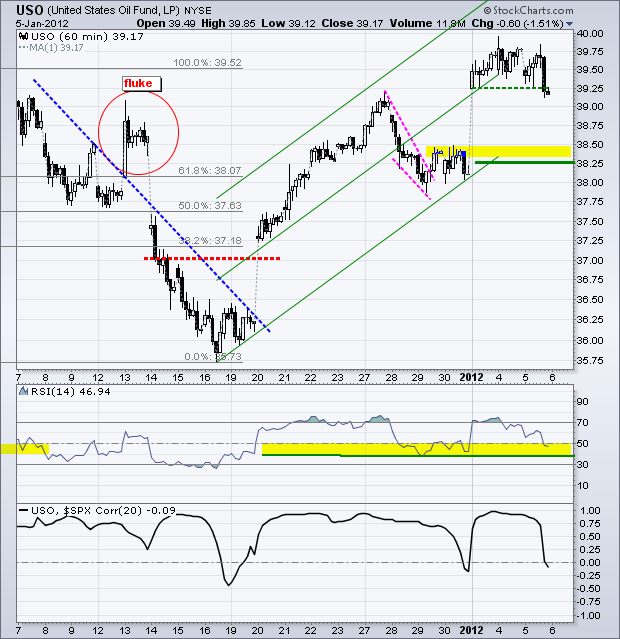
The US Oil Fund (USO) fell sharply with a break below this week's lows. Perhaps strength in the Dollar is weighing on crude. Despite this minor support break and disconnect from the stock market, I think the overall trend remains up and oil is still quite dependent on the stock market. For now, key support remains at 38.25 and RSI support at 40.
**************************************************************************
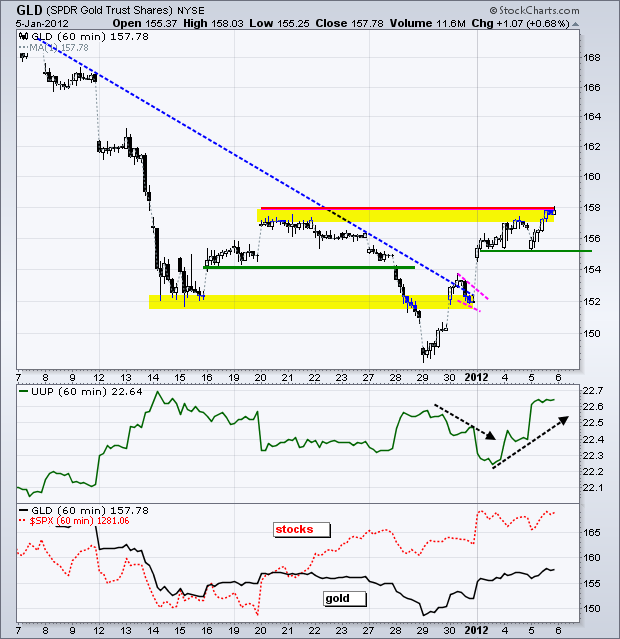
The Dollar surges and gold holds its gains. Impressive! The Gold SPDR (GLD) is challenging resistance in the 158 area. While a breakout would be bullish, GLD is short-term overbought after a surge from 149 to 158 in just five days. I am still concerned that strength in the Dollar could ultimately weigh on gold. Watch support at 155 for signs of a breakdown that could lead to a test of the December lows.
**************************************************************************
Key Economic Reports:
Fri - Jan 06 - 08:30 - Employment Report
Charts of Interest: Tuesday and Thursday in separate post.
This commentary and charts-of-interest are designed to stimulate thinking. This analysis is not a recommendation to buy, sell, hold or sell short any security (stock ETF or otherwise). We all need to think for ourselves when it comes to trading our own accounts. First, it is the only way to really learn. Second, we are the only ones responsible for our decisions. Think of these charts as food for further analysis. Before making a trade, it is important to have a plan. Plan the trade and trade the plan. Among other things, this includes setting a trigger level, a target area and a stop-loss level. It is also important to plan for three possible price movements: advance, decline or sideways. Have a plan for all three scenarios BEFORE making the trade. Consider possible holding times. And finally, look at overall market conditions and sector/industry performance.

