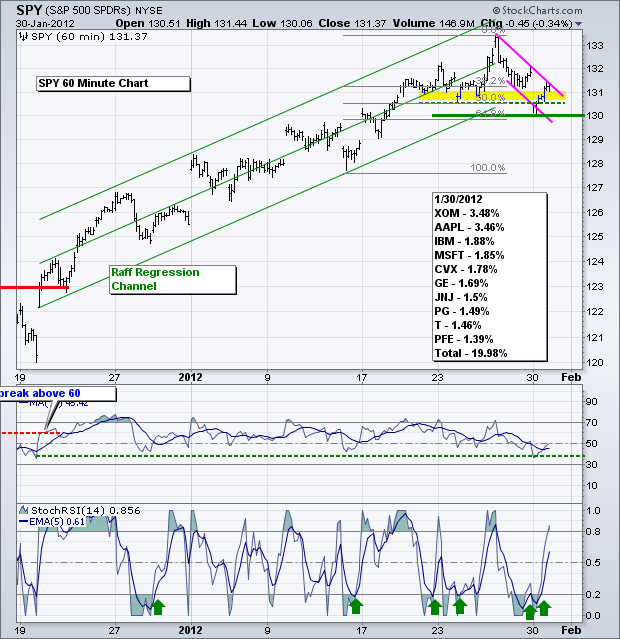
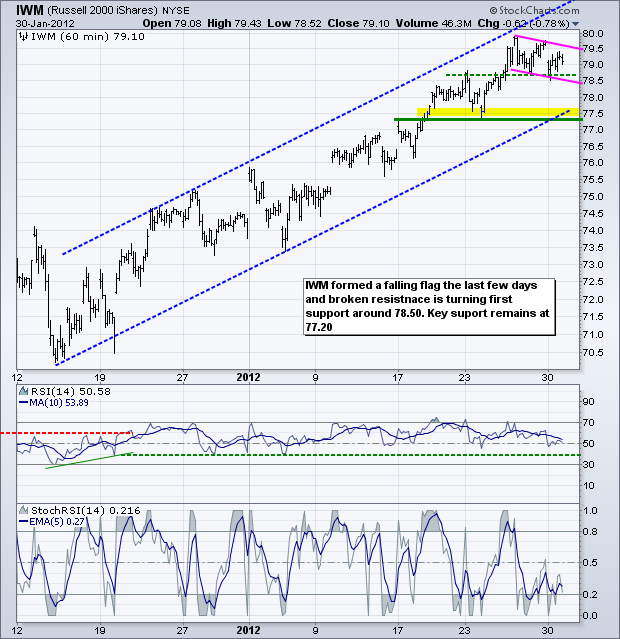
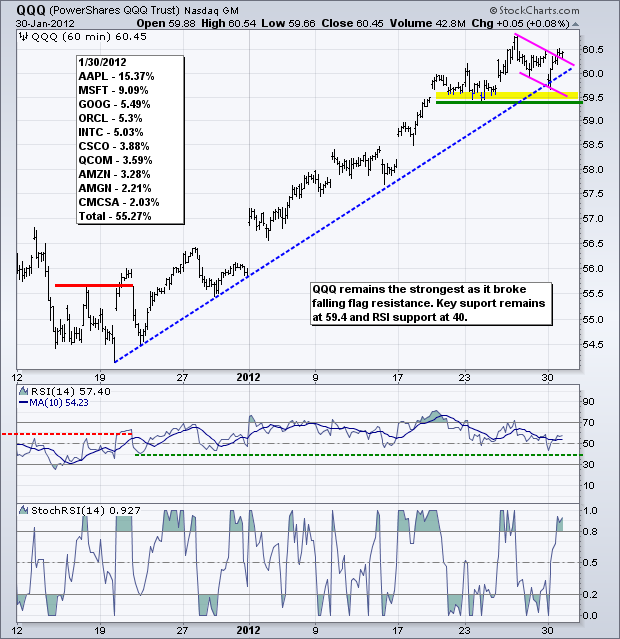
Stocks corrected somewhat over the last three days, but managed to recover after a weak open on Monday. Risk-on is in the air this morning after the EU agreed to a "fiscal compact". Stocks futures, oil, gold and the Euro are higher in early trading (4AM ET). On the 60-minute chart, SPY remains in a short-term uptrend defined by the Raff Regression Channel and key support at 130. The decline over the last three days looks like a falling flag that retraced 61.80% of the prior surge (±127.5 to ±133.5). The ETF gapped down on Monday's open, but immediately rebounded and edged higher the rest of the day. A break above flag resistance would signal a continuation higher. Even though the bigger trend is up, playing breakouts is risky with stocks overbought and the six week trend so mature. In the indicator windows, RSI tested the 40 level as SPY bounced off support at 130. Note that the economic reporting docket is chock-o-block this week and we have lots of earnings reports still to come. Exxon Mobile (XOM), Pfizer (PFE), US Steel (X) and UPS (UPS) report before the open, while Amazon (AMZN), CH Robinson (CHRW), Seagate Tech (STX) and Unisys (UIS) report after the close.
StochRSI is hyperactive version of RSI. It is the Stochastic Oscillator applied to RSI, which makes it an indicator of an indicator. When the short-term trend is up, StochRSI can be used to identify very short-term oversold conditions with a move below the .20 level. A surge from below .20 to above .80 is the early momentum signal that the short-term uptrend may be resuming. Be careful with this indicator because it is quite volatile. Chartists may even consider adding a 5-day EMA to smooth the line a bit and reduce signals. With this EMA, chartists could simply look for a move above .20 to signal that a new upswing is beginning (green arrows). There were good signals early in the short-term uptrend (late December and mid January), but the signals have soured as the trend becomes extended.
**************************************************************************
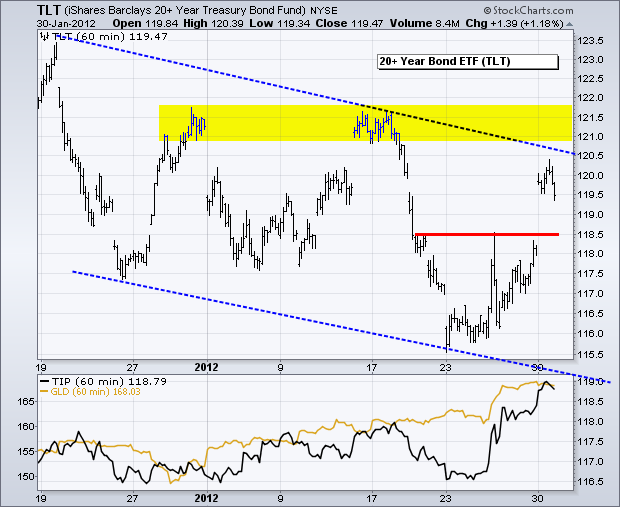
I am not sure what is driving treasuries these days. Gold, the Euro and the stock market moved higher over the last six days. This should be negative for treasuries, but they rallied with a fairly big move from Monday to Monday. The 20+ Year T-Bond ETF (TLT) has been zigzagging lower since December 19th, which is when the stock market bottomed. Despite this overall trend of lower lows and lower highs, counter trend surges have been quite strong. The move recent surge broke resistance at 118.50 and the swing within this bigger downtrend is up. Resistance is marked in the 121.5 area from the prior highs. I am wondering if inflation is lurking because the Inflation Indexed Bond ETF (TIP) hit a 52-week high on Monday and gold has been moving sharply higher since December 29th. Any whiffs of inflation would be negative for normal treasuries.
**************************************************************************
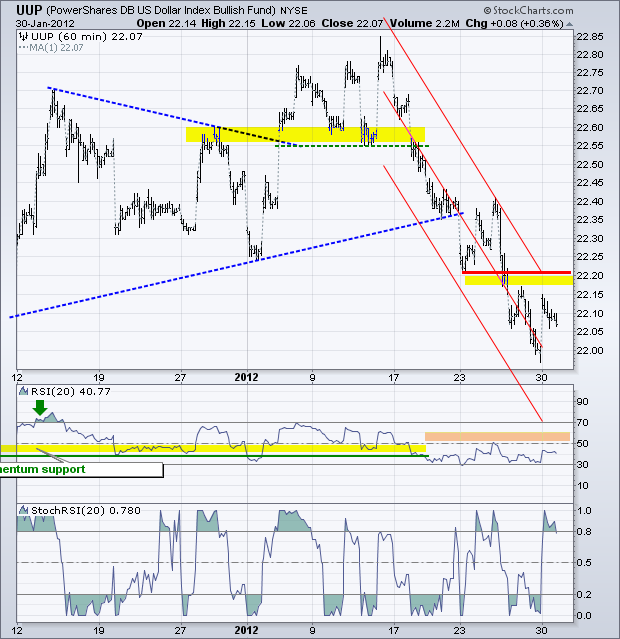
The US Dollar Fund (UUP) was blind-sided last week when the Fed announced an extension of its zero interest rate policy. This also produced a bounce in treasuries and decline in rates. UUP remains in a downtrend defined by the Raff Regression Channel. Broken support and the highs of the last two days mark a resistance zone in the 22.15 to 22.22 area. A break above this zone would reverse the short-term downtrend. Look for RSI to break 60 for confirmation.
**************************************************************************
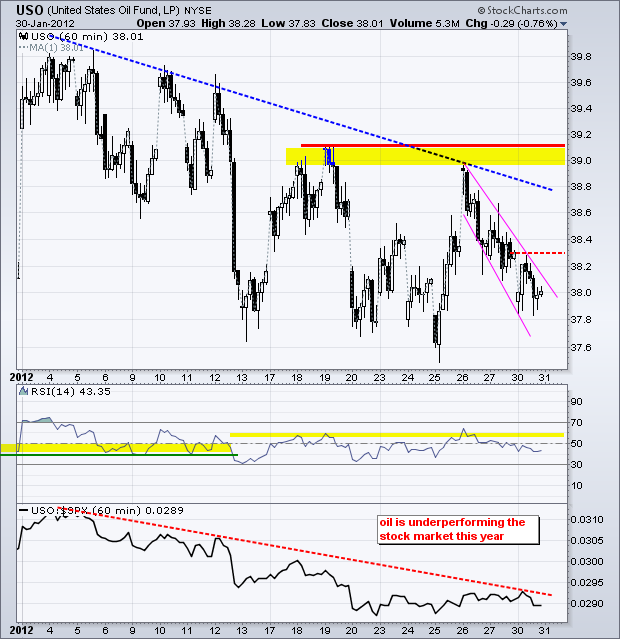
The US Oil Fund (USO) is in a downtrend over the last six weeks with key resistance in the 39 area. After a surge last week, the ETF moved lower with a falling channel the last few days. This is perhaps a large falling flag. Monday's high marks first resistance at 38.30 and a break above this level would provide the early bullish signal. Look for RSI to break 60 for confirmation.
**************************************************************************
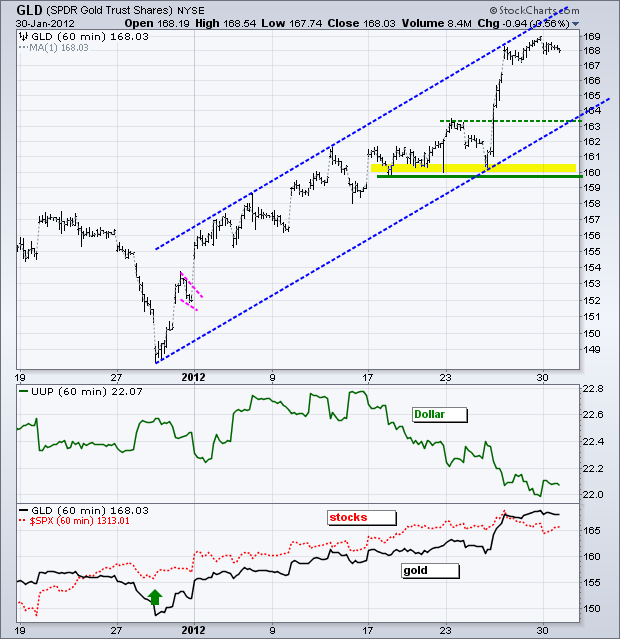
The Gold SPDR (GLD) is up some 13% from its late December low (±149). Even though the ETF is overbought, there are simply no signs of weakness. GLD surged above 169 last week, held its gains and consolidated the last 2-3 days. As noted last week, gold is the un-currency and continues to attract money as an alternative to the Euro and Dollar. Broken resistance and the late December trendline mark first support at 163. Key support remains at 160 for now.
**************************************************************************
Key Economic Reports:
Tue - Jan 31 - 09:00 - Case-Shiller Housing Index
Tue - Jan 31 - 09:45 - Chicago PMI
Tue - Jan 31 - 10:00 - Consumer Confidence
Wed - Feb 01 - 07:00 - MBA Mortgage Index
Wed - Feb 01 - 08:15 - ADP Employment Report
Wed - Feb 01 - 10:00 - ISM Manufacturing Index
Wed - Feb 01 - 10:00 - Construction Spending
Wed - Feb 01 - 10:30 - Oil Inventories
Wed - Feb 01 - 14:00 – Auto/Truck Sales
Thu - Feb 02 - 07:30 - Challenger Job Cuts
Thu - Feb 02 - 08:30 - Jobless Claims
Fri - Feb 03 - 08:30 – Employment Report
Fri - Feb 03 - 10:00 - Factory Orders
Fri - Feb 03 - 10:00 - ISM Services
Charts of Interest: Tuesday and Thursday in separate post.
This commentary and charts-of-interest are designed to stimulate thinking. This analysis is not a recommendation to buy, sell, hold or sell short any security (stock ETF or otherwise). We all need to think for ourselves when it comes to trading our own accounts. First, it is the only way to really learn. Second, we are the only ones responsible for our decisions. Think of these charts as food for further analysis. Before making a trade, it is important to have a plan. Plan the trade and trade the plan. Among other things, this includes setting a trigger level, a target area and a stop-loss level. It is also important to plan for three possible price movements: advance, decline or sideways. Have a plan for all three scenarios BEFORE making the trade. Consider possible holding times. And finally, look at overall market conditions and sector/industry performance.

