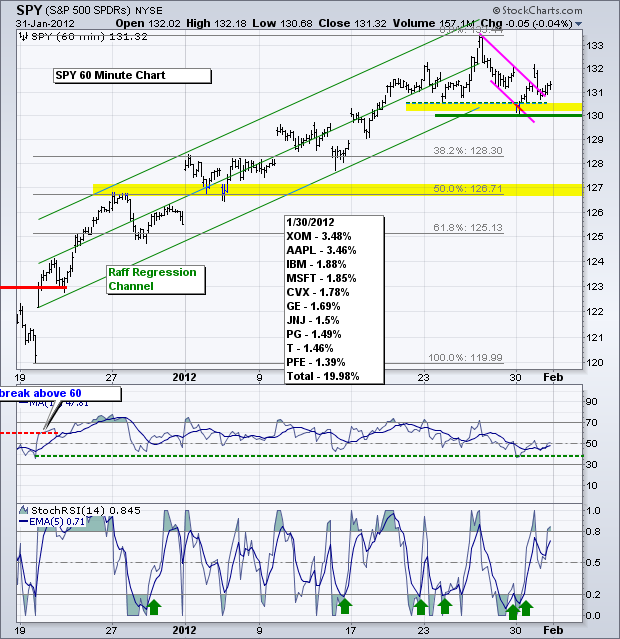
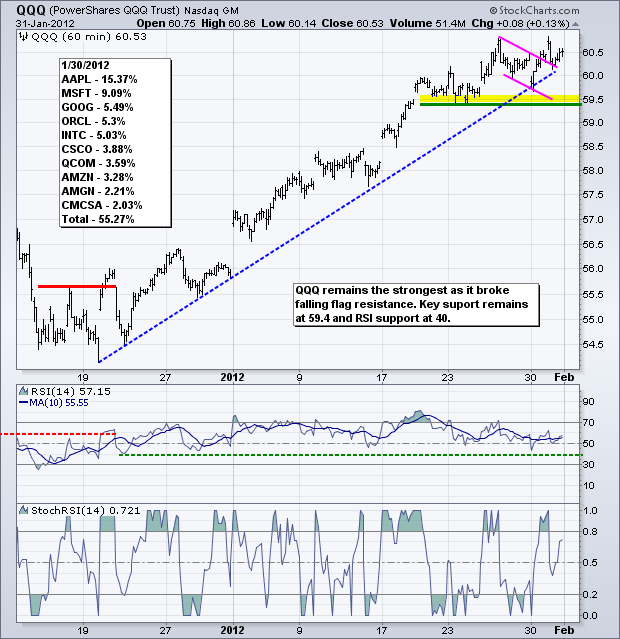
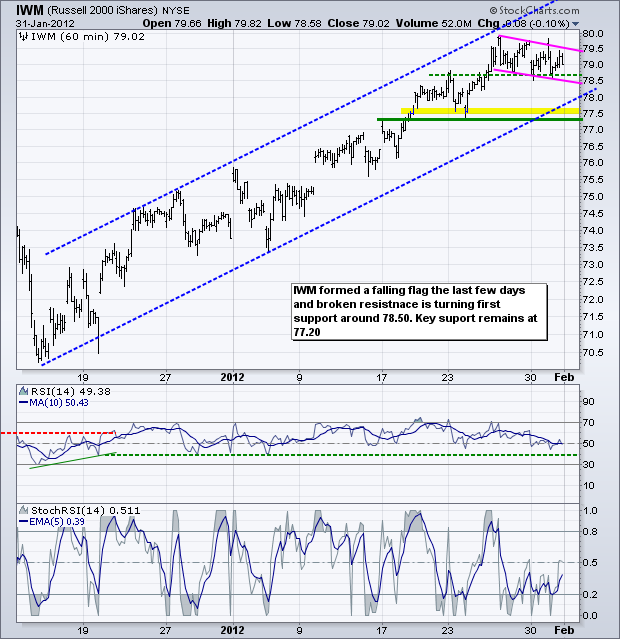
The intermarket arena shows a shift from risk-on to risk-off over the last six to seven days. The 20+ Year T-Bond ETF (TLT) and the Gold SPDR (GLD) are up over 4%, while the US Oil Fund (USO) and the S&P 500 ETF (SPY) are down slightly. The surge in both gold and treasuries is concerning because these two are typically negatively correlated. It is a rather odd flight to quality. Money moving into treasuries is money that is not available for stocks. Stocks are holding up for now, but something needs to give. Stocks are likely to remain under pressure as long as treasuries stay strong. I would also expect strength in treasuries to be bullish for the Dollar, which is the safe-haven currency. On the price charts, the S&P 500 ETF (SPY) bounced off support in the 130-131 area and broke flag resistance on the open. This breakout was rather tentative as the ETF fell back immediately after the open. Perhaps overbought conditions are starting to weigh. Nevertheless, stocks remain in uptrends overall and we have yet to see a major breech of key support. A break below 130 in SPY and 40 in RSI would reverse this short-term uptrend and signal the start of a correction. We could then see some sort of choppy trading range or a zigzag lower that retraces around 50% of the prior advance. Broken resistance, the early January low and the 50% retracement mark potential support in the 127 area.
**************************************************************************
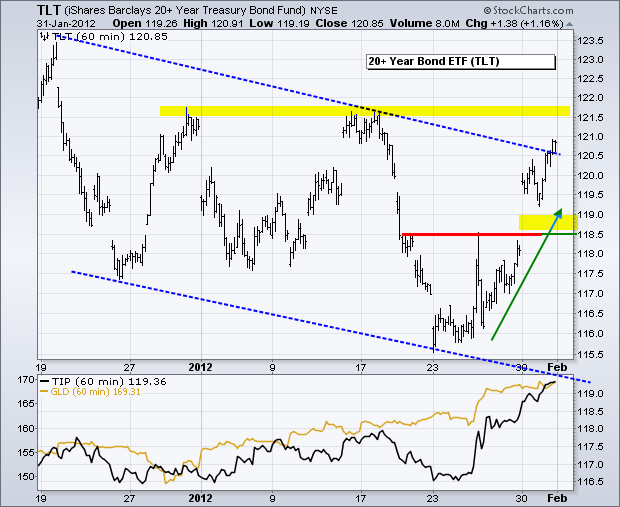
After moving below 116 last Monday (23-Jan), the 20+ Year T-Bond ETF (TLT) broke resistance at 118.50 and surged above 120.5 on Tuesday. The trend since December 19th is down as the ETF zigzags lower, but the swing within this downtrend is clearly up. In fact, this swing may be strong enough to produce a breakout, which would be negative for stocks and positive for the Dollar. A big test is awaiting as the economic docket heats up over the next three days. Broken resistance and the gap zone turn first support in the 118.5-119 area.
**************************************************************************
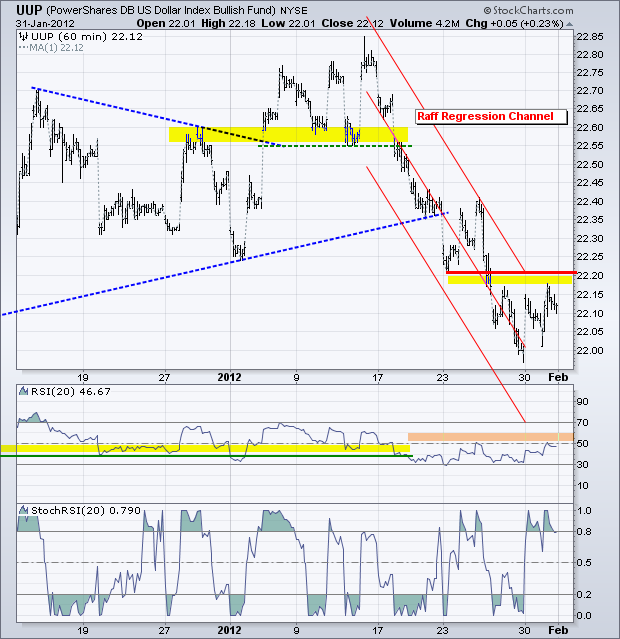
The US Dollar Fund (UUP) firmed over the last few days, but remains in a downtrend and short of a trend-changing breakout. The Raff Regression Channel, broken support and the highs of the last few days mark a resistance zone in the 22.20 area. RSI also has resistance in the 50-60 zone. Look for breaks above these resistance zones to reverse the downtrend. A breakout in the Dollar would be bearish for stocks and oil, but bullish for treasuries.
**************************************************************************
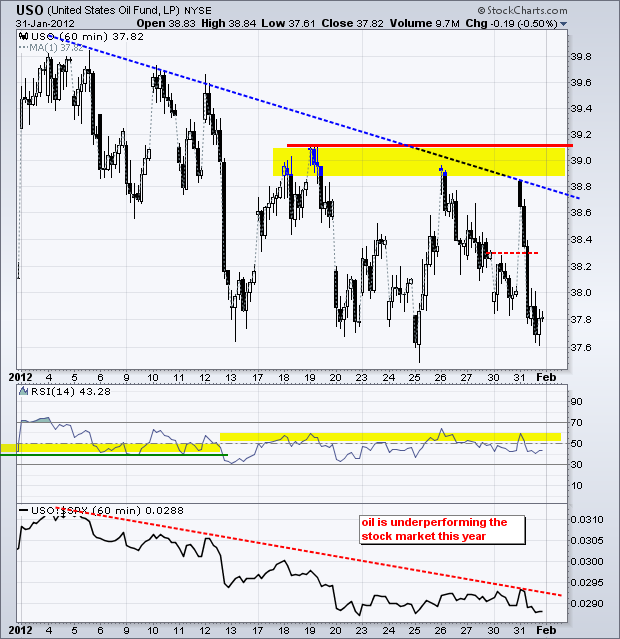
The US Oil Fund (USO) surged above flag/channel resistance with a strong move on the open, but immediately fell back as resistance in the 38.8-39.10 area held. Oil has been trending lower since early January and continues to underperform the stock market. A trading range has taken shape the last few weeks with support in the 37.6 area and resistance in the 39 area. After the latest failure, I would expect USO to break support and continue lower. RSI resistance remains at 60.
**************************************************************************
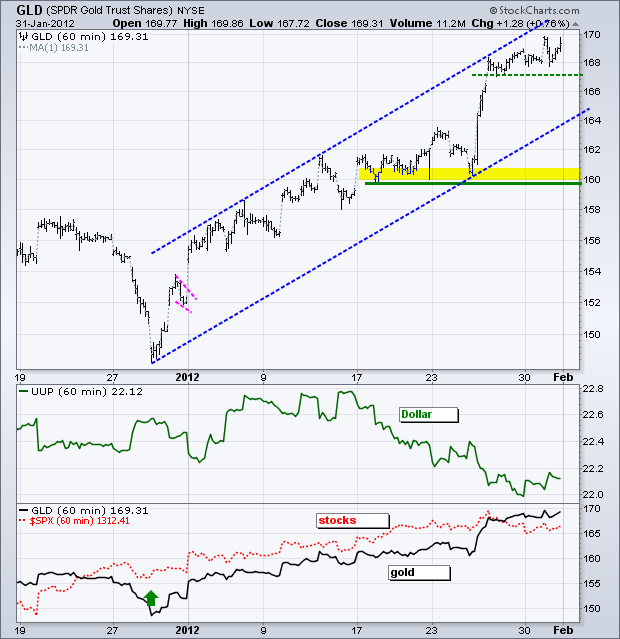
The Gold SPDR (GLD) is up some 13% from its late December low (±149). Even though the ETF is overbought, there are simply no signs of weakness. GLD surged above 169 last week, held its gains and consolidated the last 3-4 days. As noted last week, gold is the un-currency and continues to attract money as an alternative to the Euro and Dollar. The lows of the last few days mark first support at 167. Key support remains at 160 for now, but will likely be raised in the coming days.
**************************************************************************
Key Economic Reports:
Wed - Feb 01 - 07:00 - MBA Mortgage Index
Wed - Feb 01 - 08:15 - ADP Employment Report
Wed - Feb 01 - 10:00 - ISM Manufacturing Index
Wed - Feb 01 - 10:00 - Construction Spending
Wed - Feb 01 - 10:30 - Oil Inventories
Wed - Feb 01 - 14:00 – Auto/Truck Sales
Thu - Feb 02 - 07:30 - Challenger Job Cuts
Thu - Feb 02 - 08:30 - Jobless Claims
Fri - Feb 03 - 08:30 – Employment Report
Fri - Feb 03 - 10:00 - Factory Orders
Fri - Feb 03 - 10:00 - ISM Services
Charts of Interest: Tuesday and Thursday in separate post.
This commentary and charts-of-interest are designed to stimulate thinking. This analysis is not a recommendation to buy, sell, hold or sell short any security (stock ETF or otherwise). We all need to think for ourselves when it comes to trading our own accounts. First, it is the only way to really learn. Second, we are the only ones responsible for our decisions. Think of these charts as food for further analysis. Before making a trade, it is important to have a plan. Plan the trade and trade the plan. Among other things, this includes setting a trigger level, a target area and a stop-loss level. It is also important to plan for three possible price movements: advance, decline or sideways. Have a plan for all three scenarios BEFORE making the trade. Consider possible holding times. And finally, look at overall market conditions and sector/industry performance.


