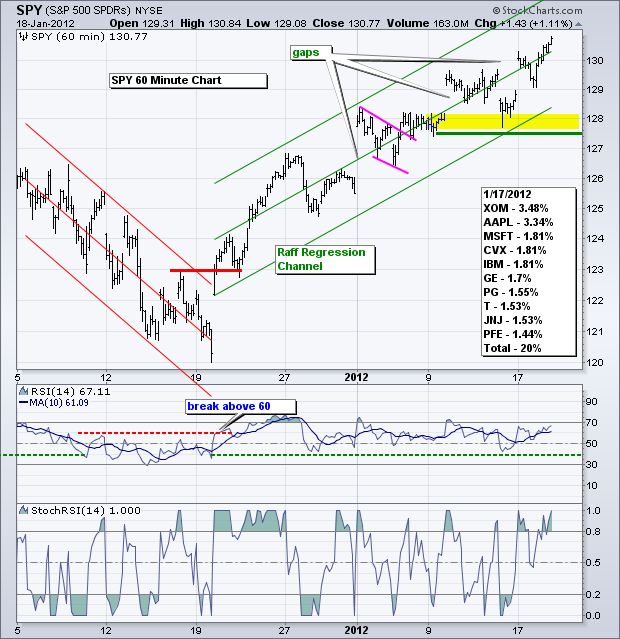
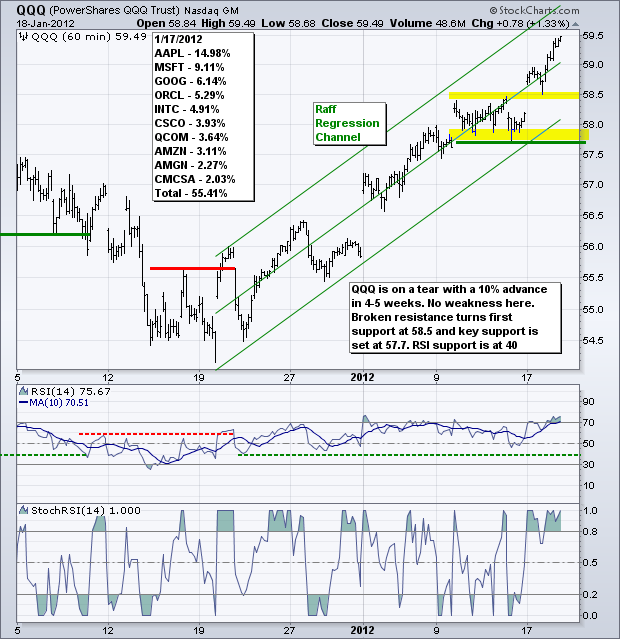
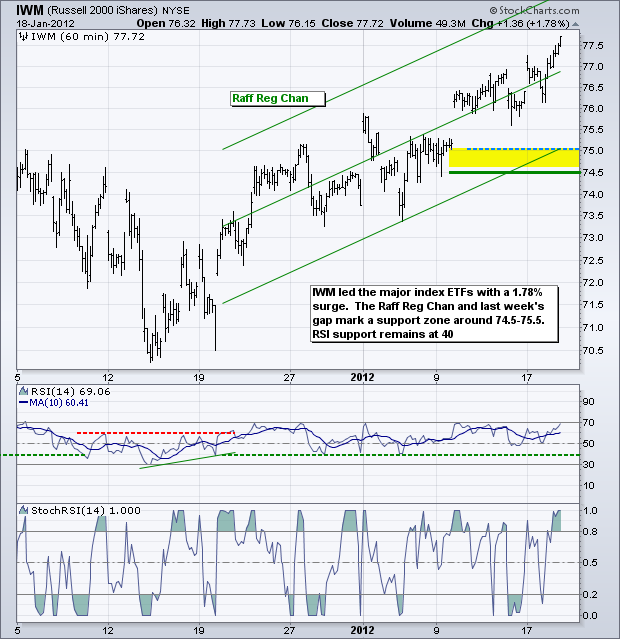
It is a big day on the earnings front. Judging from the rally over the last 4-5 weeks, it looks like most reports will be better than expected. Financials dominate the premarket reports with Bank of America, BB&T and Morgan Stanley reporting earnings before the open on Thursday. Technology stocks will be in focus after the close with Microsoft, Intel, IBM and Google reporting. The short-term trend remains up as IWM, QQQ and SPY all hit new highs for the move. Stocks opened relatively flat on Wednesday and then climbed throughout the day. Stocks may be overbought and this uptrend may seem overextended, but we have yet to see signs of material selling pressure or significant loss in upside momentum. The S&P 500 ETF (SPY) closed near its high of the day and I extended the Raff Regression Channel to match this closing high. For now, I will leave key support at 127.50. RSI broke above 60 on December 20th and has yet to move below 40. RSI's bull range is 40 to 80 and the bear range is 20 to 60. A move below 40 is needed to signal a bearish shift in momentum.
**************************************************************************
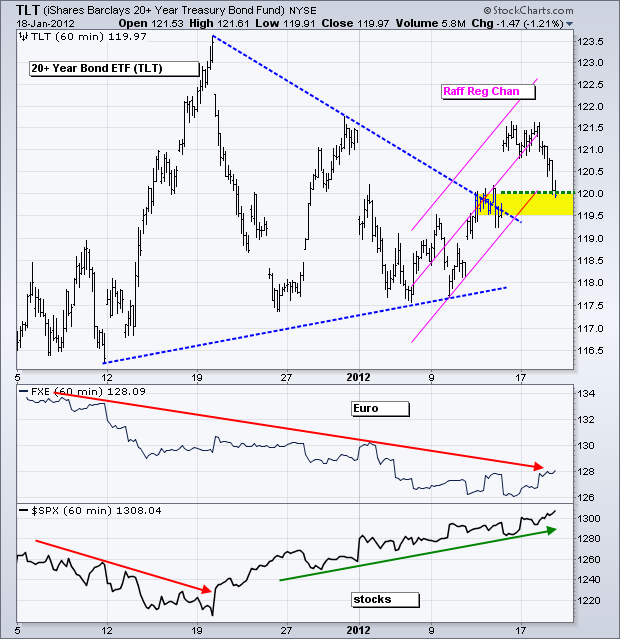
Treasuries could not take it anymore as the 20+ Year T-Bond ETF (TLT) fell from resistance on Wednesday. Strength in stocks and the Euro meant money was moving into the risk-on trade. TLT backed off resistance and gave back Friday's advance with a move below 120. TLT moved above 121.5 in early trading and this allowed me to extend the Raff Regression Channel. With the decline below 120, the ETF broke the lower trendline. Despite the failure at resistance and trendline break, TLT remains a tough call because the bigger triangle breakout from last week turns into support around 119.5-120.
**************************************************************************
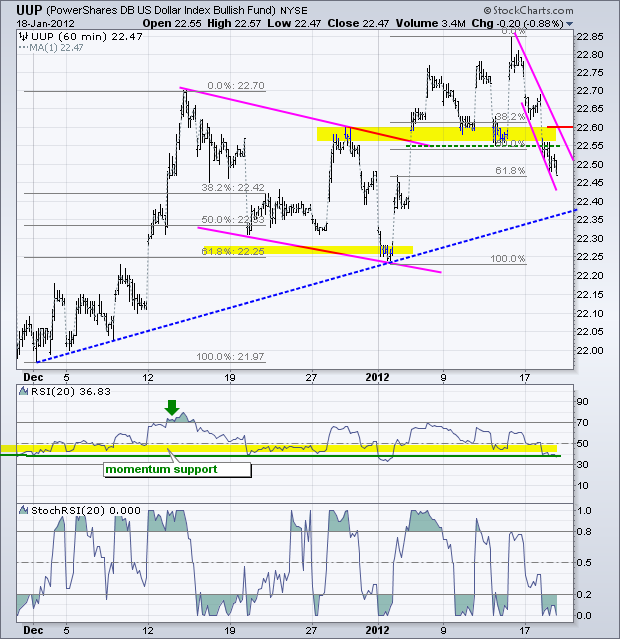
The US Dollar Fund (UUP) continued lower on Wednesday and broke first support at 22.55. While this support break is short-term bearish, I still think the bigger trend is up for the Dollar. This means we could see support somewhere above the early January low. Perhaps the trendline extending up from the December low will mark support around 22.35-22.40. RSI broke below 40 for the second time since late November.
**************************************************************************
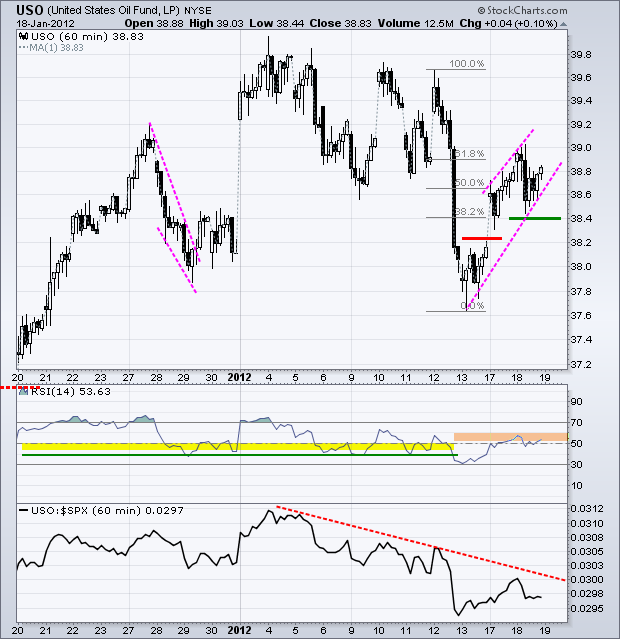
The US Oil Fund (USO) followed the stock market with a small gain on Wednesday. Even so, the current advance looks like a rising wedge and the ETF retraced 61.80% of the prior decline. Combined with RSI in its resistance zone and relative weakness in oil, USO could be setting up for a bearish reversal here. Note that RSI broke below 40 last week and the 50-60 zone now turns resistance. The lower indicator window shows USO underperforming the stock market since early January. A break below 38.40 in USO would provide the first bearish trigger. Keep an eye on the stock market though. Continued strength in stocks could limit price weakness in oil.
**************************************************************************
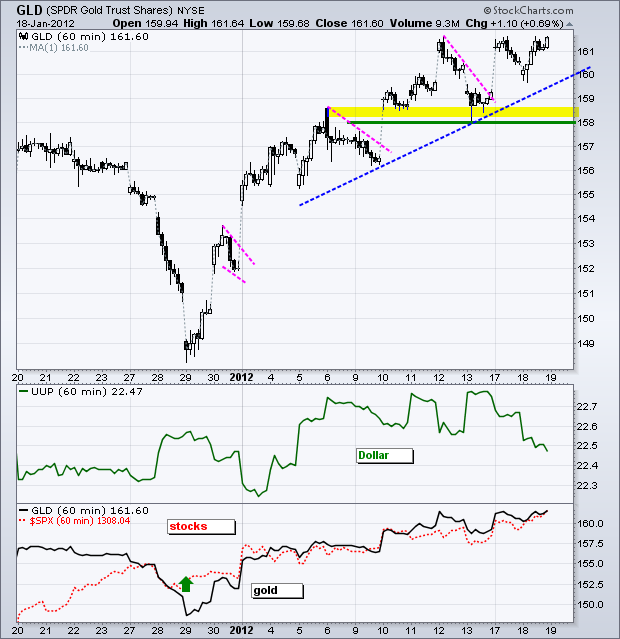
Gold benefitted from strength in stocks and weakness in the Dollar. As noted before, I think gold is more tied to the stock market (positive) than the Dollar (negative). On the price chart, the Gold SPDR (GLD) continues to work its way higher with higher highs and higher lows this year. Broken resistance turns key support at 158.
**************************************************************************
Key Economic Reports:
Thu - Jan 19 - 08:30 – Spanish Medium and Long Term Bond Auction
Thu - Jan 19 - 08:30 - Jobless Claims
Thu - Jan 19 - 08:30 - Consumer Price Index (CPI)
Thu - Jan 19 - 08:30 - Housing Starts/Building Permits
Thu - Jan 19 - 10:00 - Philadelphia Fed
Thu - Jan 19 - 11:00 - Oil Inventories
Fri - Jan 20 - 10:00 - Existing Home Sales
Mon - Jan 23 – 08:00 – EU Finance Ministers Meeting
Mon - Jan 30 – 08:00 – EU Heads of State Meeting
Mon - Jan 30 – 08:00 – Italian Medium and Long Term Bond Auction
Charts of Interest: Tuesday and Thursday in separate post.
This commentary and charts-of-interest are designed to stimulate thinking. This analysis is not a recommendation to buy, sell, hold or sell short any security (stock ETF or otherwise). We all need to think for ourselves when it comes to trading our own accounts. First, it is the only way to really learn. Second, we are the only ones responsible for our decisions. Think of these charts as food for further analysis. Before making a trade, it is important to have a plan. Plan the trade and trade the plan. Among other things, this includes setting a trigger level, a target area and a stop-loss level. It is also important to plan for three possible price movements: advance, decline or sideways. Have a plan for all three scenarios BEFORE making the trade. Consider possible holding times. And finally, look at overall market conditions and sector/industry performance.
