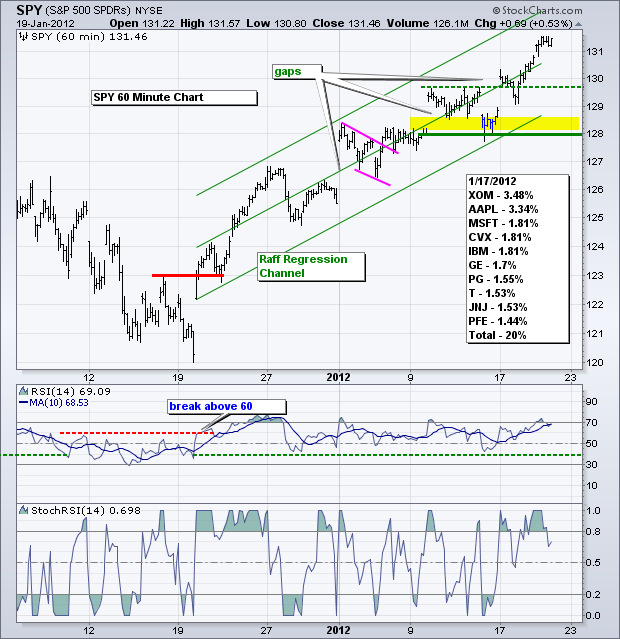
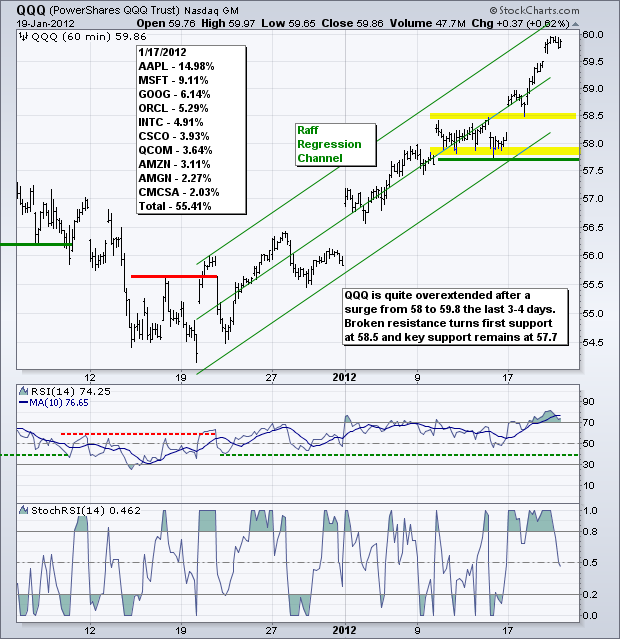
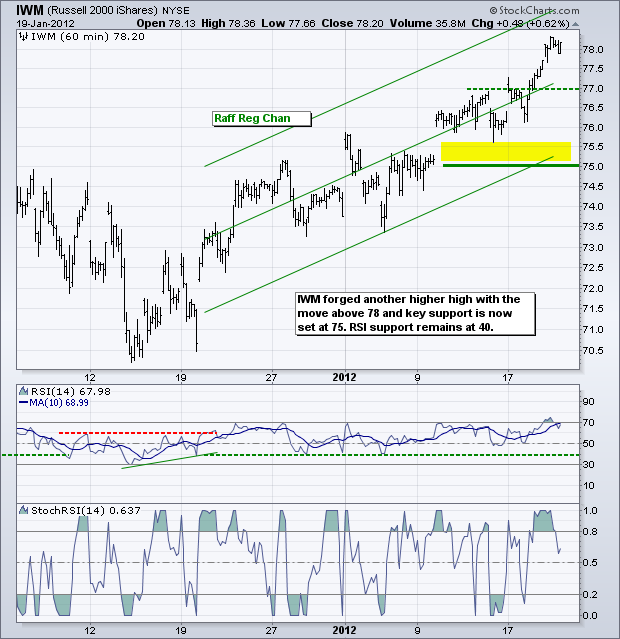
Bank and tech earnings were largely positive on Thursday and stocks moved higher. Today we will hear from Schlumberger and General Electric, which will impact oil services and industrials. Stocks extended their gains on Thursday as the major index ETFs notched new highs for this short-term uptrend. The absolute gains were modest, but there were gains nonetheless. Less strength is not the same as weakness. Less strength signals less buying pressure, but buying pressure is still stronger than selling pressure. Similarly, sideways price action signals a standoff between buying pressure and selling pressure, and is not the same as weakness. The trend will reverse when selling pressure overtakes buying pressure - not a moment sooner. SPY opened above 131 and closed above 131 to merit another extension of the Raff Regression Channel. The lower trendline marks support around 128.50, but I am going to set key support at 128. Support slowly rises as the ETF continues to make new highs. A break below 128 in SPY and 40 in RSI would reverse this short-term uptrend.
**************************************************************************
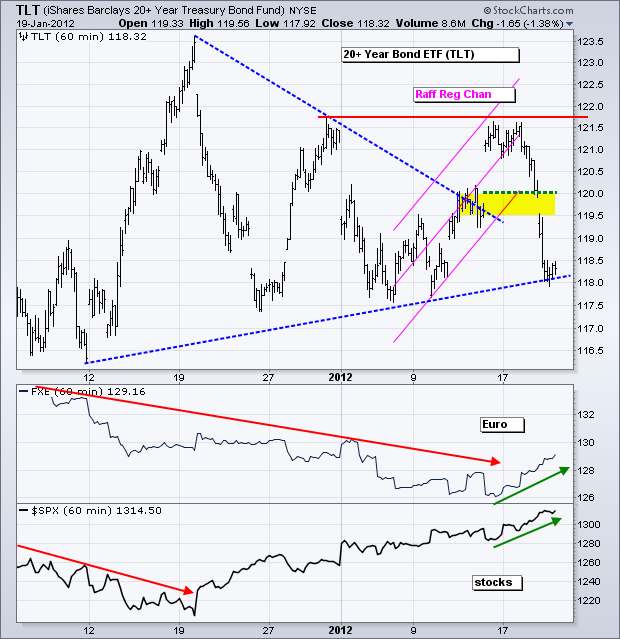
Treasuries fell further on Thursday as stocks and the Euro remained strong. The risk-on trade is negative for treasuries and the 20+ Year T-Bond ETF (TLT) failed at resistance from the late December high. The triangle breakout also failed to hold and the ETF is testing support from the lower trendline of the triangle. There is also support in the 118 area from the early January lows. TLT will remain under pressure as long as stocks and the Euro are strong.
**************************************************************************
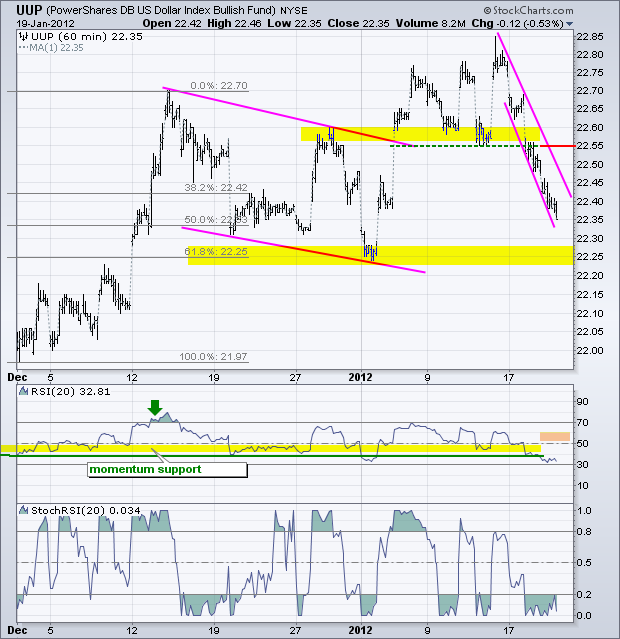
The US Dollar Fund (UUP) broke below support at 22.55 and continued lower on Thursday. The flag breakout did not hold and the ETF is now approaching its prior lows from late December and early January. Most Dollar weakness can be attributed to Euro strength as successful bond auctions in Spain and France boosted confidence in the Euro. I still think the long-term Dollar trend is up and this is a correction, albeit steep. Watch for signs of stability at or just above the next support zone around 22.25.
**************************************************************************
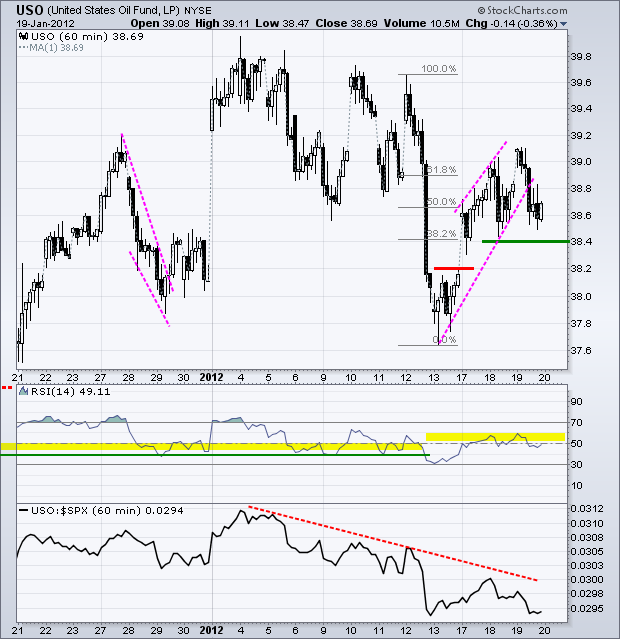
The US Oil Fund (USO) opened strong and then moved lower. Oil did not follow the stock market higher and has been underperforming since early January. Notice that the ETF retraced around 61.80% of the prior decline with a rising wedge. USO broke the wedge trendline and RSI is meeting resistance in the 50-60 zone. This looks like a bearish setup and a break below 38.40 would complete the short-term reversal.
**************************************************************************
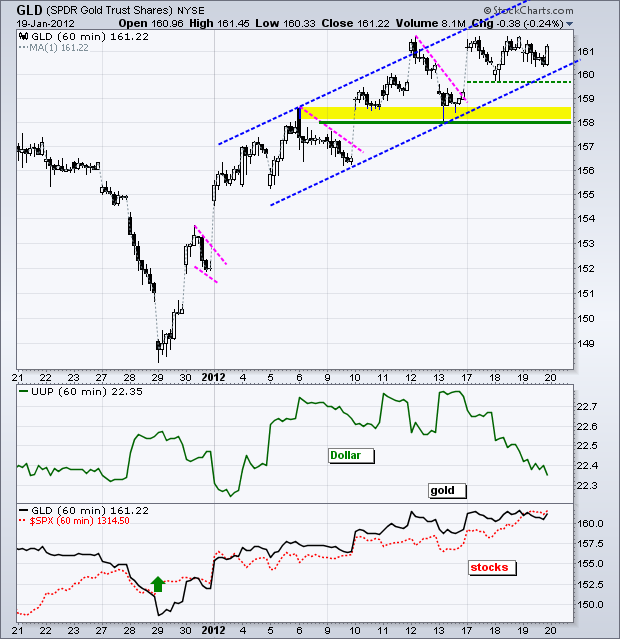
The Gold SPDR (GLD) remains in an uptrend defined by a rising channel this year. The ETF has simply been zigzagging up with a series of higher highs and higher lows. This week's low marks first support. Key support remains at 158.
**************************************************************************
Key Economic Reports:
Thu - Jan 19 - 11:00 - Oil Inventories
Fri - Jan 20 - 10:00 - Existing Home Sales
Mon - Jan 23 – 08:00 – EU Finance Ministers Meeting
Mon - Jan 30 – 08:00 – EU Heads of State Meeting
Mon - Jan 30 – 08:00 – Italian Medium and Long Term Bond Auction
Charts of Interest: Tuesday and Thursday in separate post.
This commentary and charts-of-interest are designed to stimulate thinking. This analysis is not a recommendation to buy, sell, hold or sell short any security (stock ETF or otherwise). We all need to think for ourselves when it comes to trading our own accounts. First, it is the only way to really learn. Second, we are the only ones responsible for our decisions. Think of these charts as food for further analysis. Before making a trade, it is important to have a plan. Plan the trade and trade the plan. Among other things, this includes setting a trigger level, a target area and a stop-loss level. It is also important to plan for three possible price movements: advance, decline or sideways. Have a plan for all three scenarios BEFORE making the trade. Consider possible holding times. And finally, look at overall market conditions and sector/industry performance.


