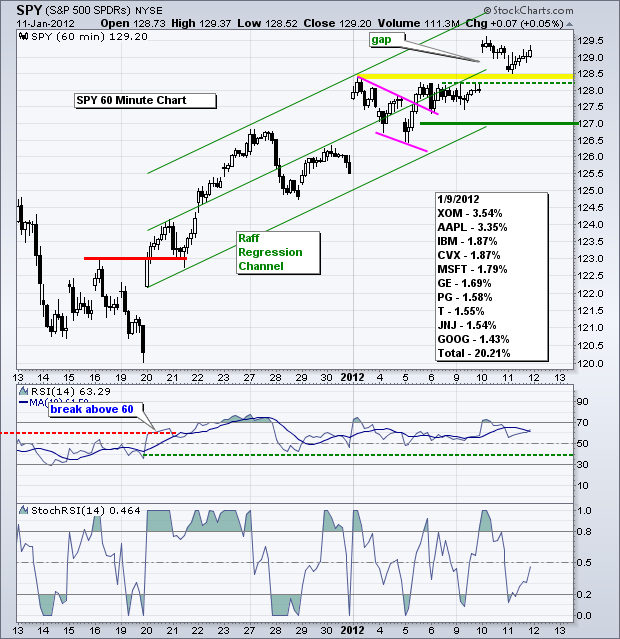
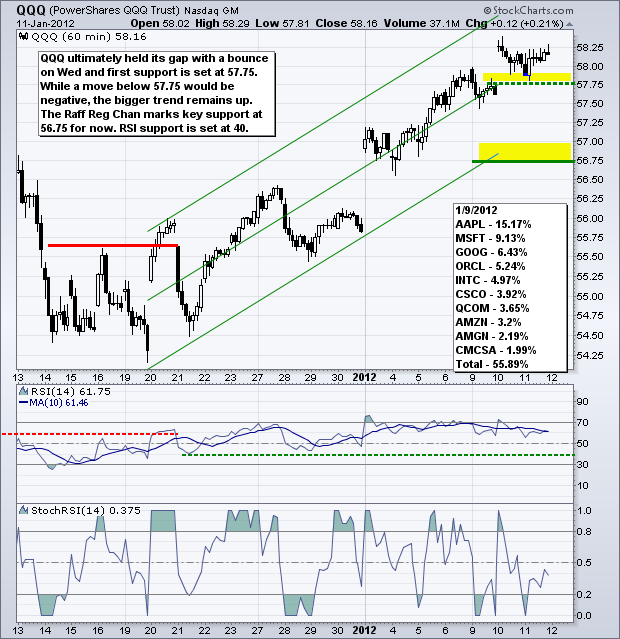
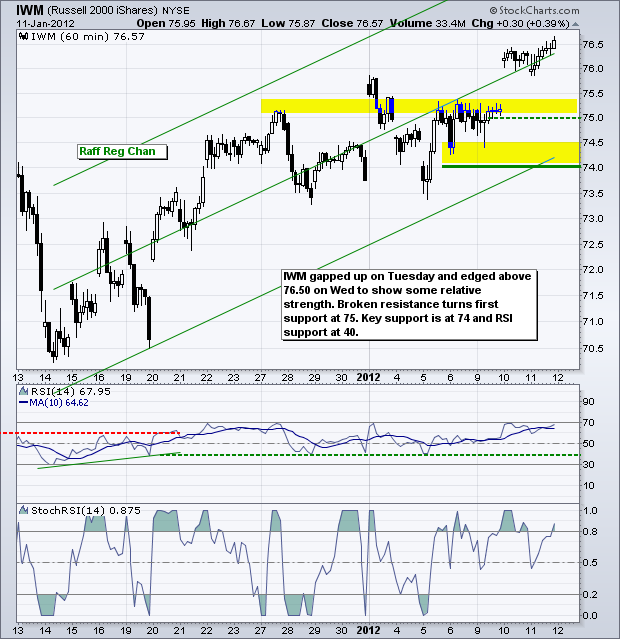
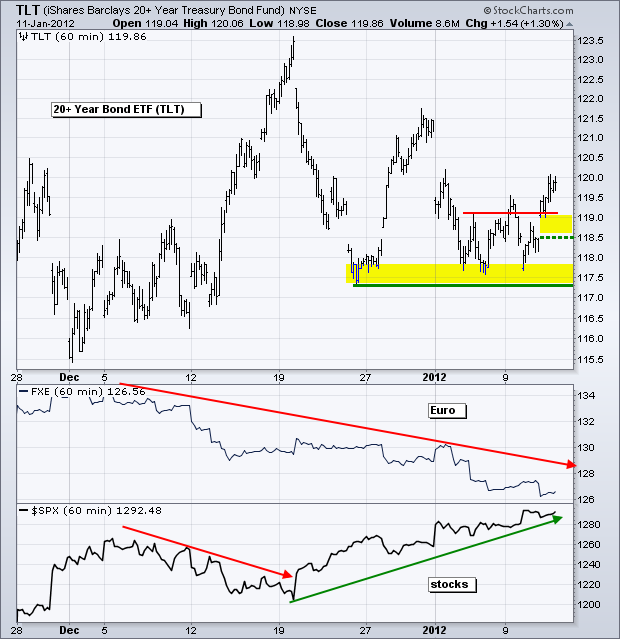
The intermarket picture is getting a bit strange. We have already seen the Euro and the stock market decouple in 2012. Over the last three days, we are also seeing a positive correlation between treasuries and stocks. These two were negatively correlated throughout 2011 and I am most concerned with recent strength in treasuries. Note that the 20+ Year T-Bond ETF (TLT) was up 1.3% on Wednesday. While I think the stock market can continue higher even with a weak Euro, I am not sure how long this rally will last if treasuries remain strong. Something needs to give. Either the rally in treasuries fails and stocks continue higher or treasuries continue higher and stocks reverse their short-term uptrends. Today could be the decider because retail sales will be reported before the open. A strong report would be bullish for stocks and bearish for treasuries, while a weak report would be bearish for stocks and bullish for treasuries. The S&P 500 ETF (SPY) remains in an uptrend overall and is now up almost 8% from its December 19th low. This strong has created a short-term overbought condition that makes the market ripe for a pullback or consolidation. Tuesday's gap is holding and broken resistance marks first support around 128.2. I am raising key support to 127. A move below this level and an RSI break below 40 would reverse this short-term uptrend.
**************************************************************************
The 20+ Year T-Bond ETF (TLT) bounced off support for the second time in two weeks and exceeded Monday's high. The successful support test and higher high are bullish. Also keep in mind that the bigger trend is up for TLT. Broken resistance and the gap turn first support at 118.50. Key support remains at 117.30.
**************************************************************************
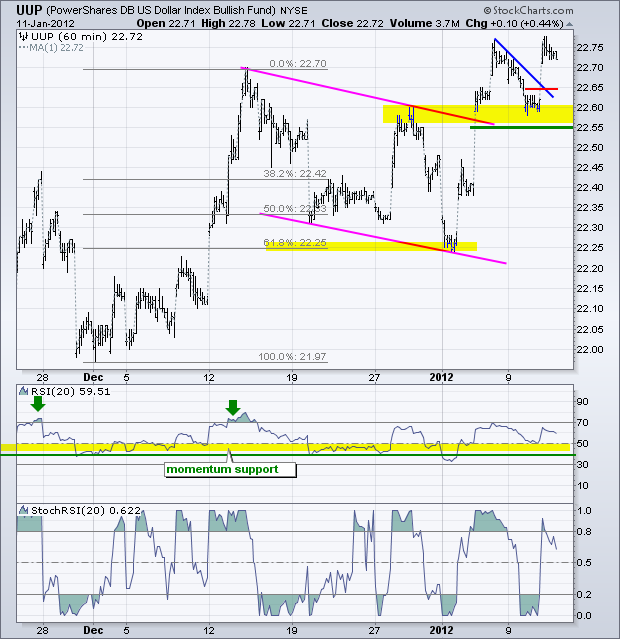
Today is a big day for the Euro as Spain and Italy auction some 17 billion Euros worth of debt. The US Dollar Fund (UUP) broke falling flag resistance with a surge last week and successfully tested this breakout with a bounce this week. Broken resistance turns support in the 22.55-22.60 area. RSI support remains at 40.
**************************************************************************
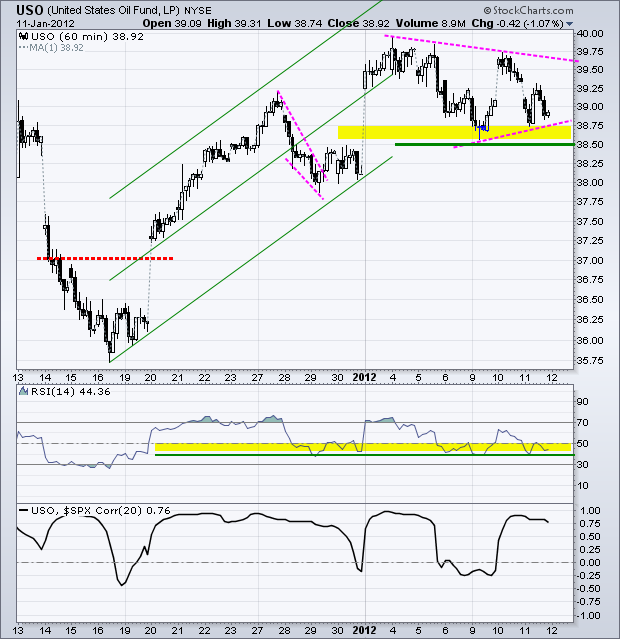
The US Oil Fund (USO) is having all kinds of problems keeping up with the stock market in 2012. Stocks are higher this year, but oil is flat as USO trades within a triangle. Strength in the Dollar could be hampering oil and I am watching the triangle boundaries for clues. A break below support at 38.50 would be bearish, especially if confirmed with an RSI break below 40.
**************************************************************************
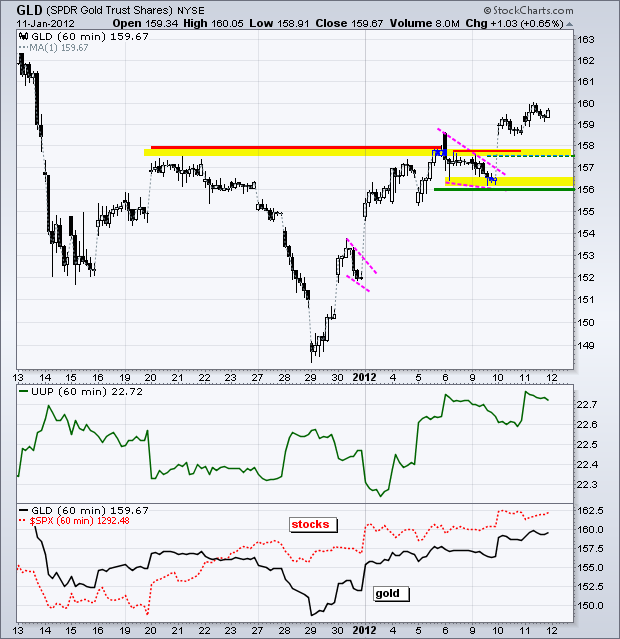
The Gold SPDR (GLD) is ignoring a strong Dollar and outperforming the stock market since December 29th. The ETF broke resistance with a surge above 158 on Tuesday and this breakout is holding. Broken resistance around 157.5-158 turns first support. Key support is set at 156.
**************************************************************************
Key Economic Reports:
Thu - Jan 12 - 08:30 - Jobless Claims
Thu - Jan 12 - 08:30 – Spain and Italy Bond Auction
Thu - Jan 12 - 08:30 - Retail Sales
Thu - Jan 12 - 10:00 - Business Inventories
Fri - Jan 13 - 09:55 - Michigan Sentiment
Mon - Jan 23 – 08:00 – EU Finance Minister Meeting (Greece)
Mon - Jan 30 – 08:00 – EU Heads of State Meeting
Charts of Interest: Tuesday and Thursday in separate post.
This commentary and charts-of-interest are designed to stimulate thinking. This analysis is not a recommendation to buy, sell, hold or sell short any security (stock ETF or otherwise). We all need to think for ourselves when it comes to trading our own accounts. First, it is the only way to really learn. Second, we are the only ones responsible for our decisions. Think of these charts as food for further analysis. Before making a trade, it is important to have a plan. Plan the trade and trade the plan. Among other things, this includes setting a trigger level, a target area and a stop-loss level. It is also important to plan for three possible price movements: advance, decline or sideways. Have a plan for all three scenarios BEFORE making the trade. Consider possible holding times. And finally, look at overall market conditions and sector/industry performance.


