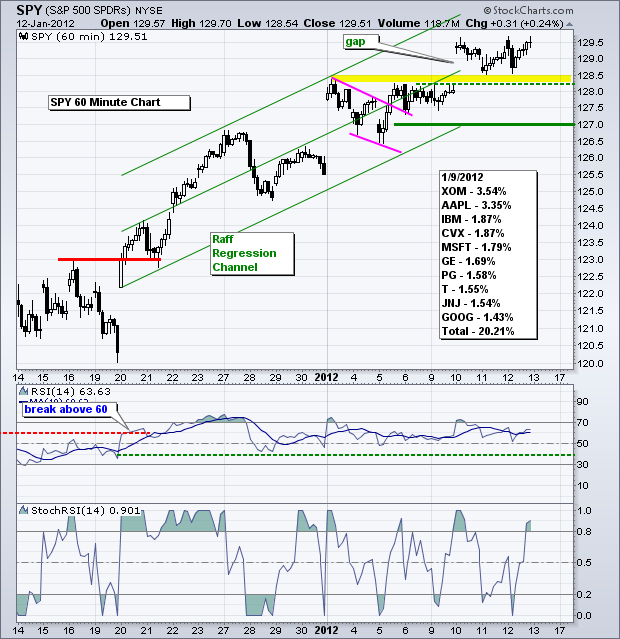
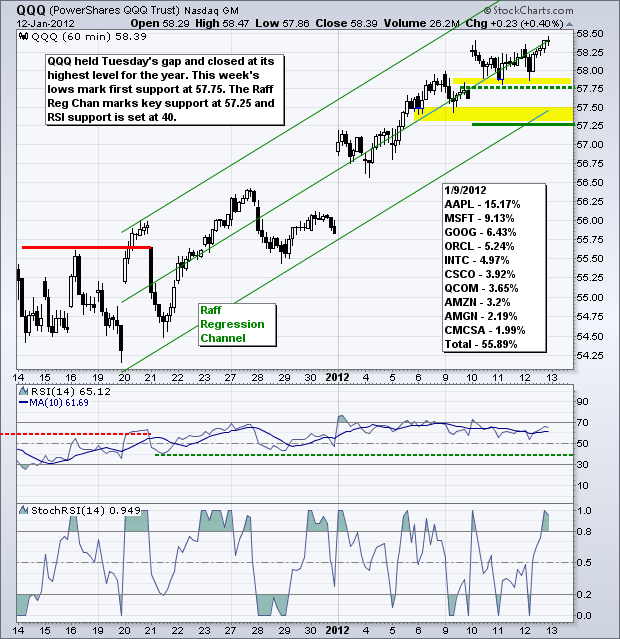
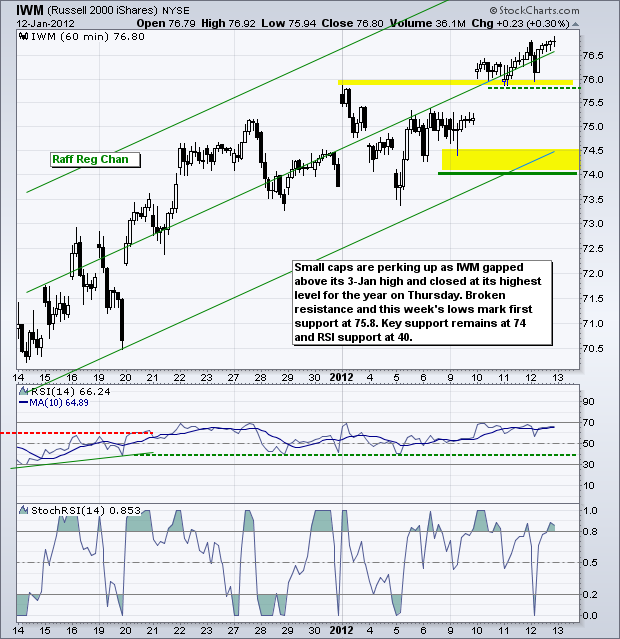
Despite lackluster retail sales, stocks recovered from early losses on Thursday and closed near their highs for the session. The sectors were mixed with materials and industrials posting the biggest gains. Utilities and energy were down. The S&P 500 ETF (SPY) remains in an uptrend on the 60-minute chart with broken resistance turning into first support in the 128.3-128.5 area. Tuesday's gap is holding and bearish thoughts are "verboden" as long as this first support level holds. Even though a break below 128.3 would be negative, I will hold out for a break below key support at 127 before considering a trend reversal. RSI support remains at 40.
**************************************************************************
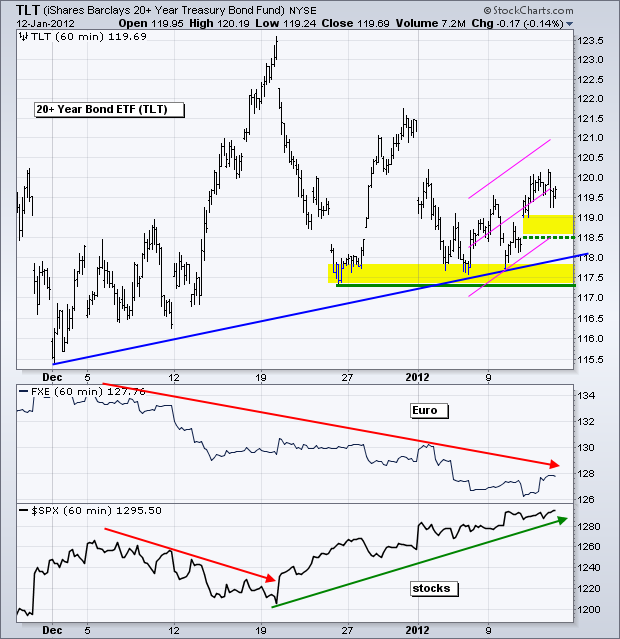
The 20+ Year T-Bond ETF (TLT) may be bouncing because the Euro is getting an oversold bounce. Strength in the Euro reduces the demand for safe havens. Also note that the Italian and Spanish debt auctions went fairly well and Draghi appears more focused on growth than Trichet (the former European Central Bank president). TLT bounced off support the last six trading days and I am marking this advance with a Raff Regression Channel. Trendlines for a flag do not align right. First support is set at 118.50 and a move below this level would increase the chances of a bigger support break.
**************************************************************************
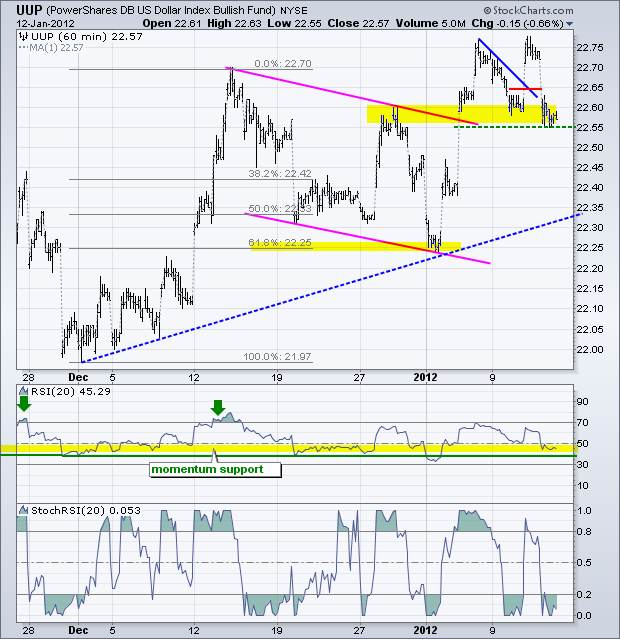
The US Dollar Fund (UUP) fell right back to its breakout and first support zone on Thursday. Improving news flow out of Europe and oversold conditions are helping the Euro, which in turn is hurting the greenback. UUP failed to hold its breakout and I think we may see further weakness in the coming days. The bigger trends remain up on the daily and weekly charts so I am not expecting a major trend reversal at this stage. However, UUP could pullback towards the 22.40 area and meet the trendline extending up from early December.
**************************************************************************
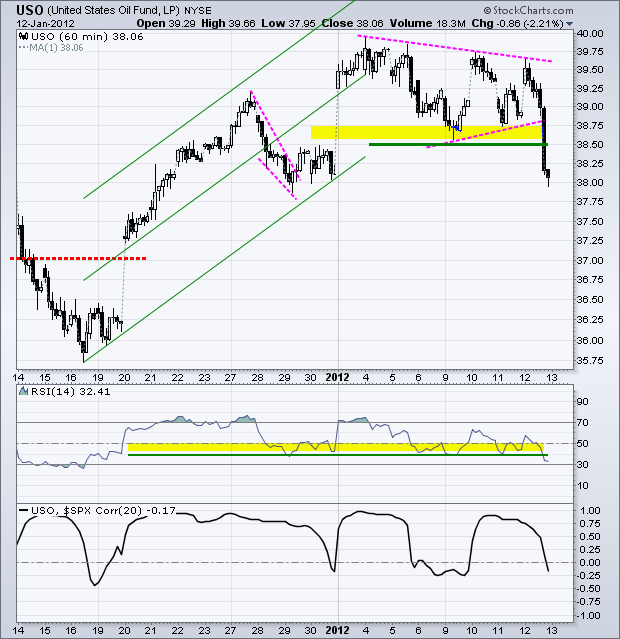
The US Oil Fund (USO) plunged after the EU said it would delay the Iran oil embargo for six months. A delay from the EU? What a surprise! Of course, this ban needs to be approved by the bloc's 27 foreign ministers on January 23rd. Iran must be having a field day with this one. In any case, this is a one off and oil will likely revert to following the stock market. On the price chart, USO broke support at 38.50 to reverse the short-term uptrend. I am, however, skeptical of this break because the stock market remains strong and the Dollar is starting to weaken.
**************************************************************************
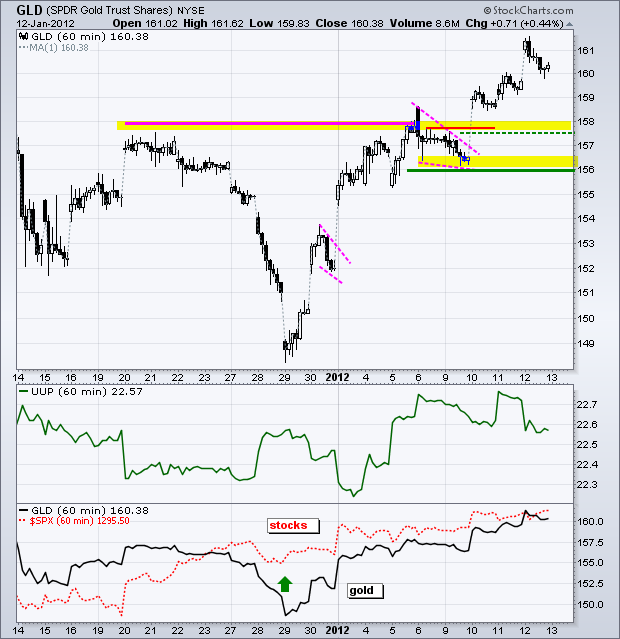
Gold and the S&P 500 have been moving higher since December 29th. Actually, the S&P 500 started its move on the 20th. The Gold SPDR (GLD) started moving higher a week later and has been following the stock market in 2012 - or maybe the stock market is following gold. Whatever the case, the positive correlation is back on in 2012. GLD broke resistance and broken resistance turns first support around 158. Key support remains at 156.
**************************************************************************
Key Economic Reports:
Fri - Jan 13 - 09:55 - Michigan Sentiment
Mon - Jan 23 – 08:00 – EU Finance Minister Meeting (Greece)
Mon - Jan 30 – 08:00 – EU Heads of State Meeting
Charts of Interest: Tuesday and Thursday in separate post.
This commentary and charts-of-interest are designed to stimulate thinking. This analysis is not a recommendation to buy, sell, hold or sell short any security (stock ETF or otherwise). We all need to think for ourselves when it comes to trading our own accounts. First, it is the only way to really learn. Second, we are the only ones responsible for our decisions. Think of these charts as food for further analysis. Before making a trade, it is important to have a plan. Plan the trade and trade the plan. Among other things, this includes setting a trigger level, a target area and a stop-loss level. It is also important to plan for three possible price movements: advance, decline or sideways. Have a plan for all three scenarios BEFORE making the trade. Consider possible holding times. And finally, look at overall market conditions and sector/industry performance.

About the author:
Arthur Hill, CMT, is the Chief Technical Strategist at TrendInvestorPro.com. Focusing predominantly on US equities and ETFs, his systematic approach of identifying trend, finding signals within the trend, and setting key price levels has made him an esteemed market technician. Arthur has written articles for numerous financial publications including Barrons and Stocks & Commodities Magazine. In addition to his Chartered Market Technician (CMT) designation, he holds an MBA from the Cass Business School at City University in London.
Learn More


