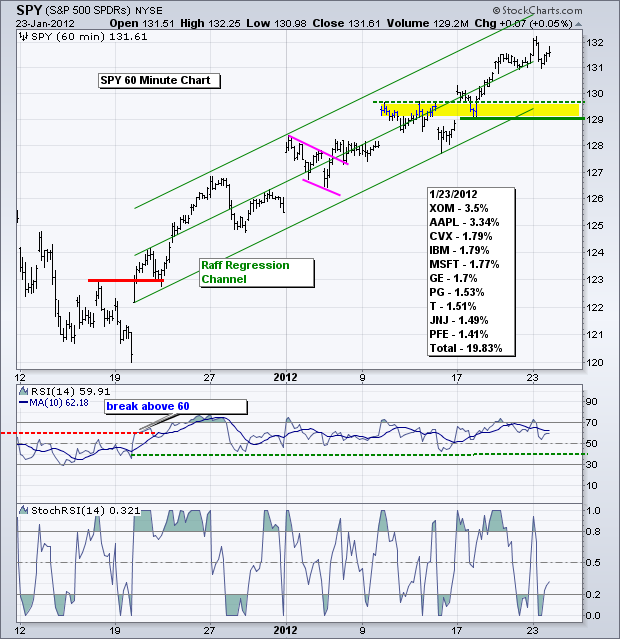
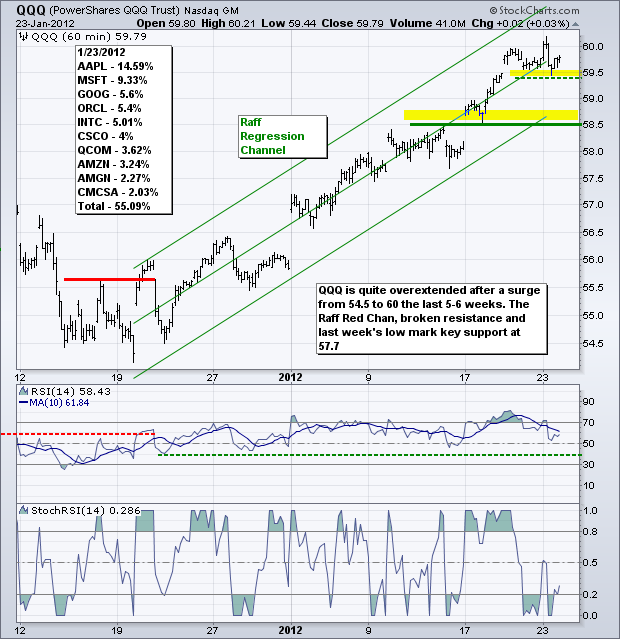
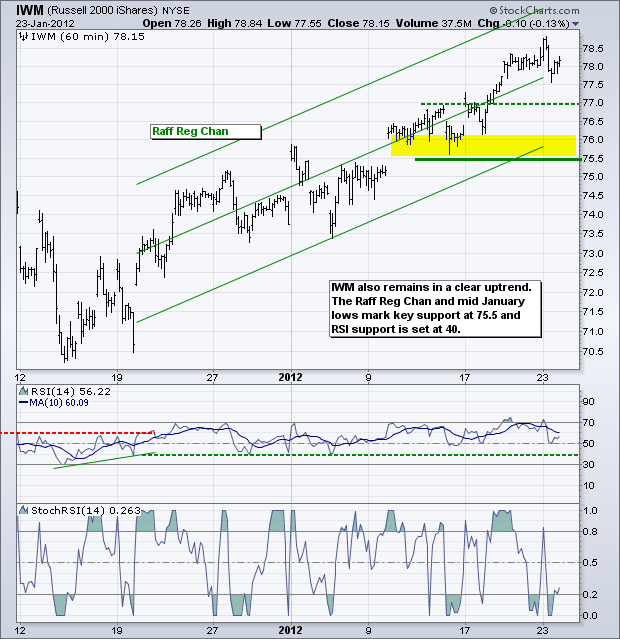
It is another big day on the earnings front. McDonalds, Baker Hughes and Air Products report before the open. Apple, Altera, AMD and Yahoo report after the market close. In addition to a big earnings week, we have EU debt wrangling, rumors on Portugal and a FOMC meeting. The US has pretty much one institution orchestrating its debt maneuvers. The EU, on the other hand, seems to have dozens. In addition to the 20 plus member nations, there is the European Central Bank (ECB), the EFSF, the IMF, the European Commission, Merkel, Sarkozy, the finance ministers summits and the heads of state summits. Sounds like a classic case of too many chiefs and too few indians. Turning to the stock market, the S&P 500 ETF (SPY) did a pop, drop and recovery to end the day virtually unchanged. It was an indecisive trading day with doji candlesticks forming on many daily charts. The short-term trend remains up for SPY, but this uptrend is getting long on tooth. SPY is up some 9% in the last 5-6 weeks without a correction. With another new high for the move, I am extending the Raff Regression Channel and marking key support at 129. Broken resistance, last week's low and the Raff Regression Channel combine to mark support here. RSI support remains at 40. A break below these levels would reverse the short-term uptrend.
**************************************************************************
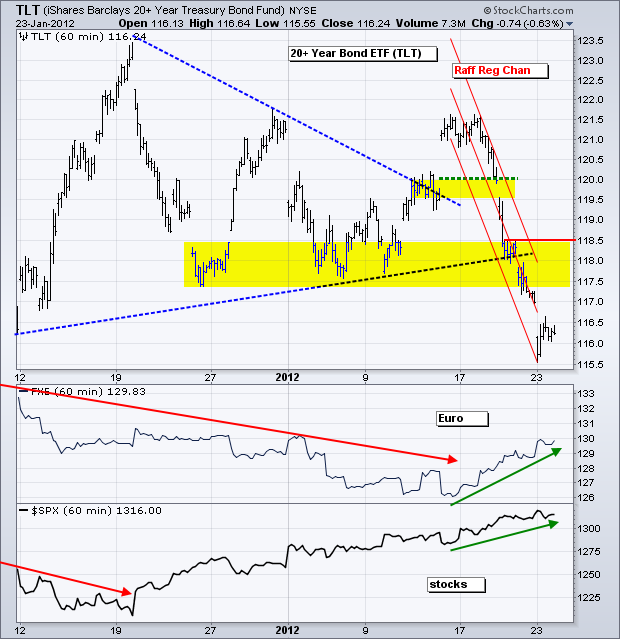
Strong economic reports, a rising stock market and a recovering Euro continue to put pressure on treasuries. Treasuries are likely to remain under pressure until something changes with these three. On the price chart, TLT broke support with a sharp decline last week and broken support turns resistance in the 117.5-118.5 area.
**************************************************************************
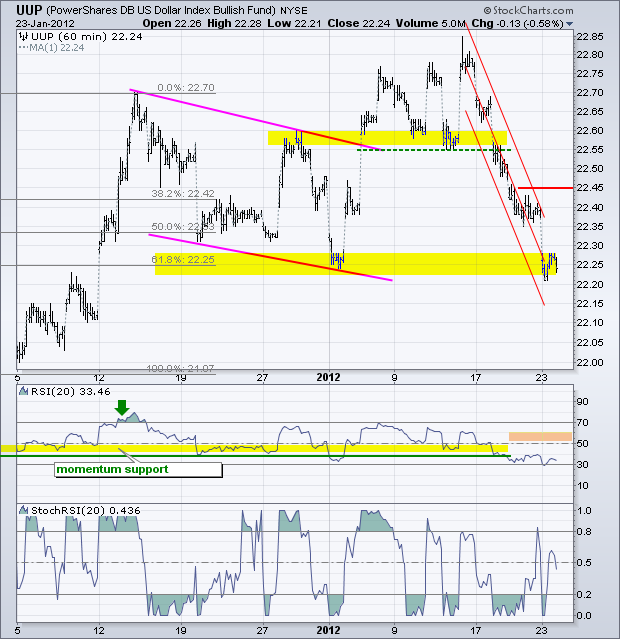
The Dollar extended its fall with a move back to the early January low. UUP is short-term oversold and at support. Also note that the long-term trend is considered up, which means this bigger uptrend could pull trump at any time. The Raff Regression Channel and Friday's high mark the first resistance zone. A break above 22.45 would reverse the six day slide.
**************************************************************************
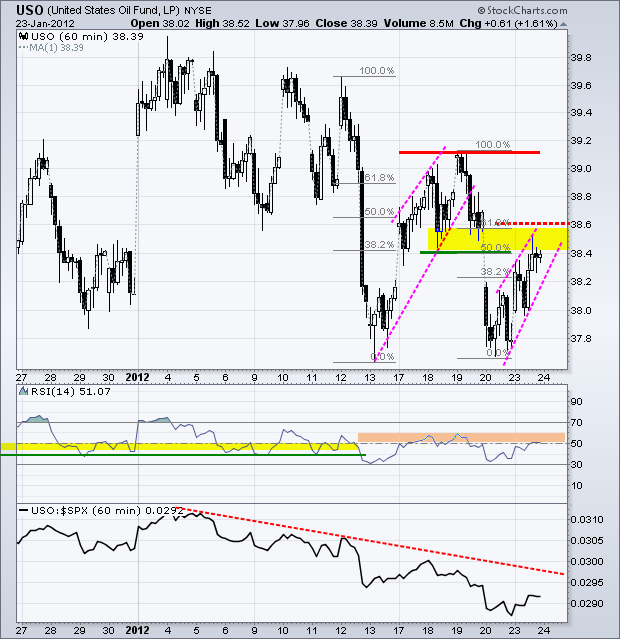
The US Oil Fund (USO) bounced back to broken support and retraced 50-61.80% of the prior decline. This is the first area to expect resistance. Also notice that a rising wedge formed and RSI is trading in the 50-60 resistance zone.
**************************************************************************
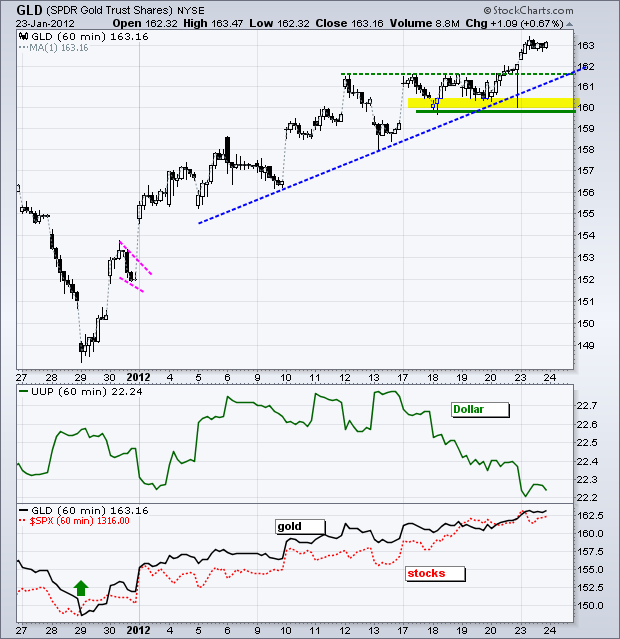
The Gold SPDR (GLD) continues to shine with another new high for the year. Gold and the stock market remain positively correlated so I will keep an eye on stocks for clues on gold. Broken resistance turns first support in the 161.6 area. Key support has been raised to 159.50.
**************************************************************************
Key Economic Reports:
Mon - Jan 23 – 08:00 – EU Finance Ministers Meeting
Wed - Jan 25 - 07:00 - MBA Mortgage Index
Wed - Jan 25 - 10:00 - Pending Home Sales
Wed - Jan 25 - 10:00 - FHFA Housing Price Index
Wed - Jan 25 - 10:30 - Crude Inventories
Wed - Jan 25 - 12:30 - FOMC Rate Decision
Thu - Jan 26 - 08:30 - Initial Claims
Thu - Jan 26 - 08:30 - Durable Orders
Thu - Jan 26 - 10:00 - New Home Sales
Thu - Jan 26 - 10:00 - Leading Indicators
Fri - Jan 27 - 08:30 - GDP
Fri - Jan 27 - 09:55 - Michigan Sentiment Mon - Jan 30 – 08:00 – EU Heads of State Meeting
Mon - Jan 30 – 08:00 – Italian Medium and Long Term Bond Auction
Charts of Interest: Tuesday and Thursday in separate post.
This commentary and charts-of-interest are designed to stimulate thinking. This analysis is not a recommendation to buy, sell, hold or sell short any security (stock ETF or otherwise). We all need to think for ourselves when it comes to trading our own accounts. First, it is the only way to really learn. Second, we are the only ones responsible for our decisions. Think of these charts as food for further analysis. Before making a trade, it is important to have a plan. Plan the trade and trade the plan. Among other things, this includes setting a trigger level, a target area and a stop-loss level. It is also important to plan for three possible price movements: advance, decline or sideways. Have a plan for all three scenarios BEFORE making the trade. Consider possible holding times. And finally, look at overall market conditions and sector/industry performance.

