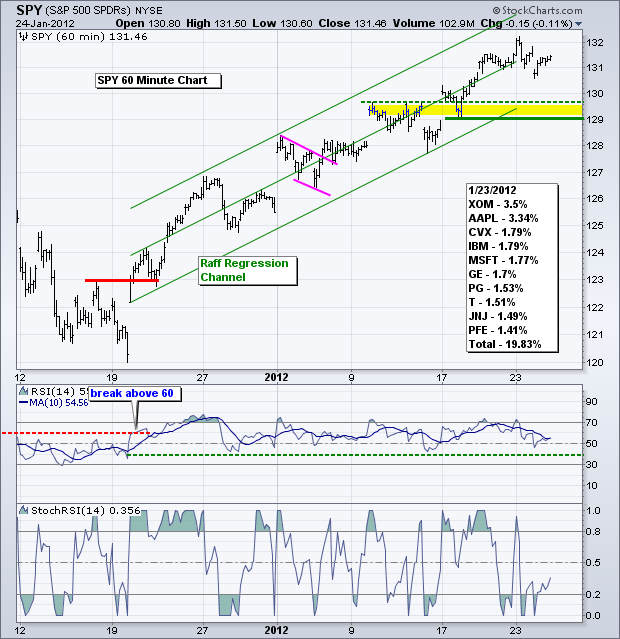
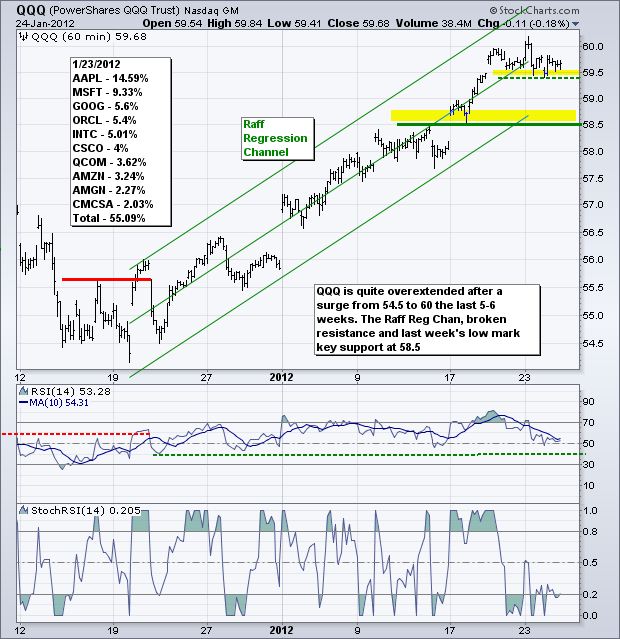
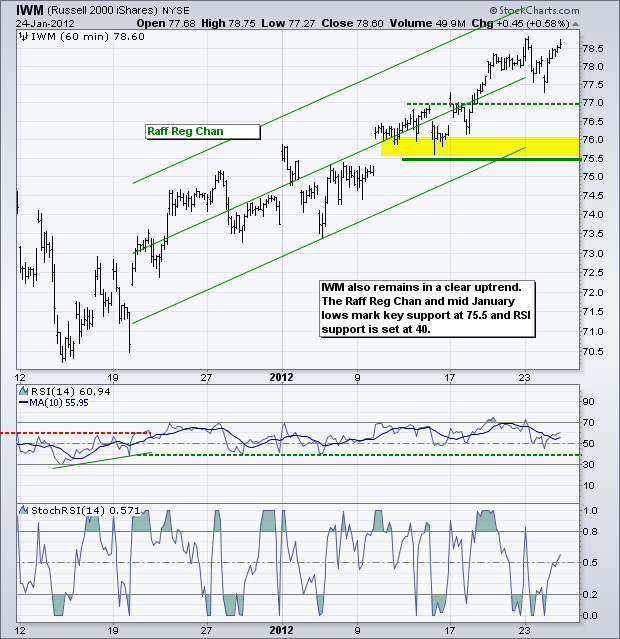
Another blowout quarter from Apple is lifting the Nasdaq futures this morning, but the rest of the market is rather subdued as the Fed's policy statement looms this afternoon. Stocks ended mixed on Tuesday as indecision continued ahead of the Fed. Small-caps were higher with the Russell 2000 ETF (IWM) and S&P SmallCap 600 ($SML) showing modest gains, but the Dow Industrials SPDR (DIA) and S&P 100 ETF (OEF) were lower. There is not much change on the charts as the S&P 500 ETF (SPY) continues to hold its short-term uptrend. Broken resistance, last week's low and the Raff Regression Channel mark key support in the 129-129.5 area. RSI support remains at 40. These are the two levels to watch for a trend reversal.
**************************************************************************
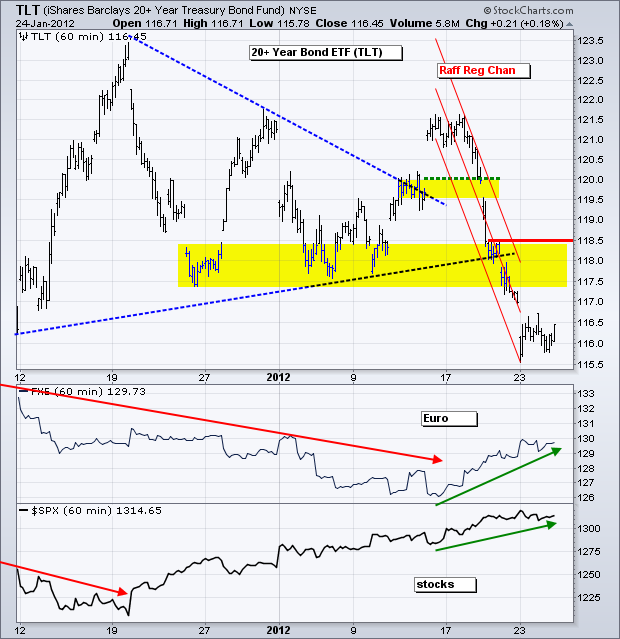
The 20+ Year T-Bond ETF (TLT) broke support with a sharp decline last week and became oversold after the move from 121.5 to 115.50. Broken support turns into resistance in the 117.5-118.5 area and we could see an oversold bounce back to this area.
**************************************************************************
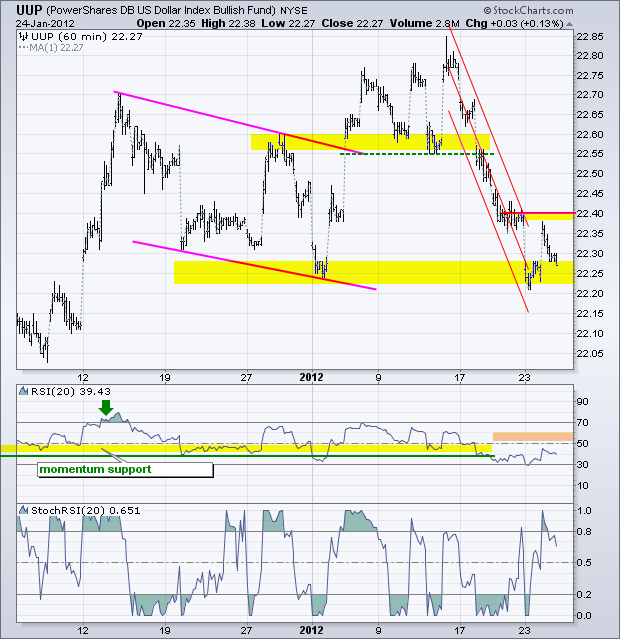
As with TLT above, the US Dollar Fund (UUP) declined sharply last week and broke support in the 22.55 area. The ETF became oversold after the move and hit support from the early January low. UUP managed to bounce early Tuesday, but fell back below 22.30 in afternoon trading. Key resistance is set at 22.40 on the price chart and RSI resistance at 60. A break above these levels would reverse the short-term downtrend.
**************************************************************************
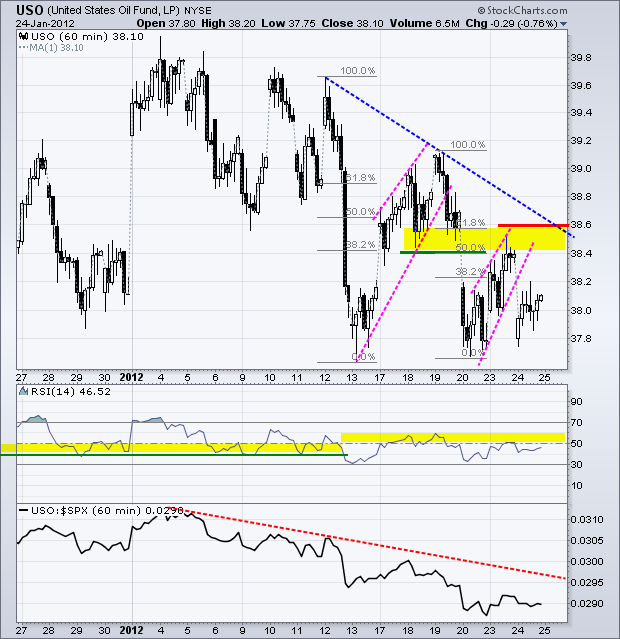
The US Oil Fund (USO) has been trending lower since early January with lower highs the last 2-3 weeks. Even though USO established support with two bounces in the 37.7 area, a higher high is needed to reverse this downtrend. USO broke rising wedge resistance with a move lower on Tuesday. We can now set key resistance at 38.6. RSI resistance is set at 60. Watch these two levels for a trend reversal.
**************************************************************************
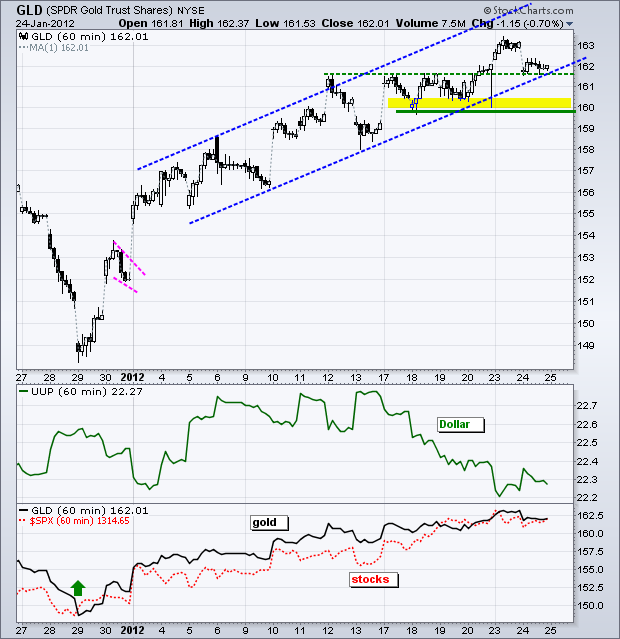
The Gold SPDR (GLD) remains in a short-term uptrend, just like the S&P 500 ETF. After a big surge in late December, the ETF has been zigzagging higher the last 3-4 weeks. This uptrend remains as long as the lows are rising. Broken resistance turns first support in the 161.50 area. Key support is set at 160.
**************************************************************************
Key Economic Reports:
Wed - Jan 25 - 07:00 - MBA Mortgage Index
Wed - Jan 25 - 10:00 - Pending Home Sales
Wed - Jan 25 - 10:00 - FHFA Housing Price Index
Wed - Jan 25 - 10:30 - Crude Inventories
Wed - Jan 25 - 12:30 - FOMC Rate Decision
Thu - Jan 26 - 08:30 - Initial Claims
Thu - Jan 26 - 08:30 - Durable Orders
Thu - Jan 26 - 10:00 - New Home Sales
Thu - Jan 26 - 10:00 - Leading Indicators
Fri - Jan 27 - 08:30 - GDP
Fri - Jan 27 - 09:55 - Michigan Sentiment
Mon - Jan 30 – 08:00 – EU Heads of State Meeting
Mon - Jan 30 – 08:00 – Italian Medium and Long Term Bond Auction
Charts of Interest: Tuesday and Thursday in separate post.
This commentary and charts-of-interest are designed to stimulate thinking. This analysis is not a recommendation to buy, sell, hold or sell short any security (stock ETF or otherwise). We all need to think for ourselves when it comes to trading our own accounts. First, it is the only way to really learn. Second, we are the only ones responsible for our decisions. Think of these charts as food for further analysis. Before making a trade, it is important to have a plan. Plan the trade and trade the plan. Among other things, this includes setting a trigger level, a target area and a stop-loss level. It is also important to plan for three possible price movements: advance, decline or sideways. Have a plan for all three scenarios BEFORE making the trade. Consider possible holding times. And finally, look at overall market conditions and sector/industry performance.


