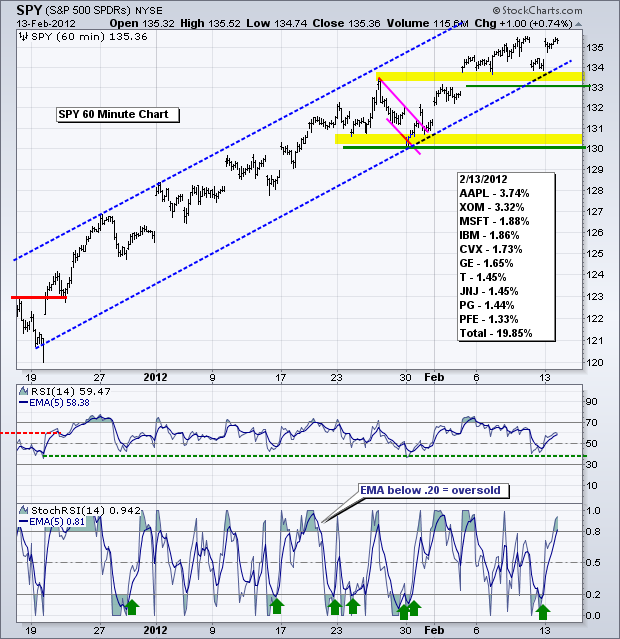
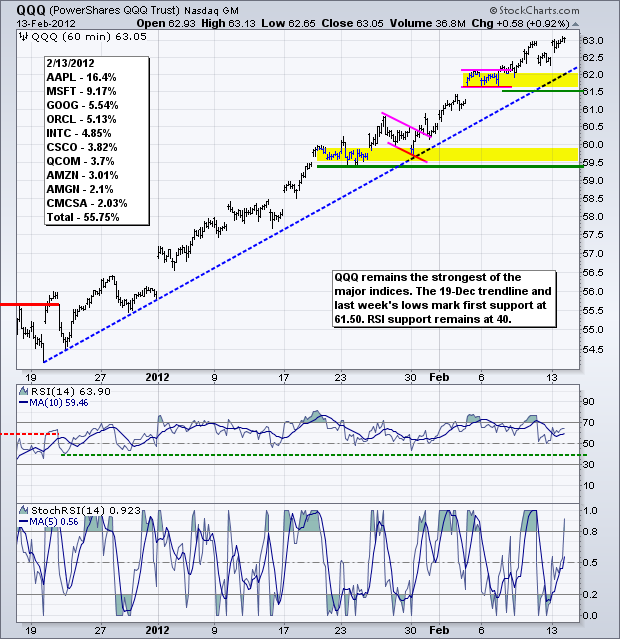
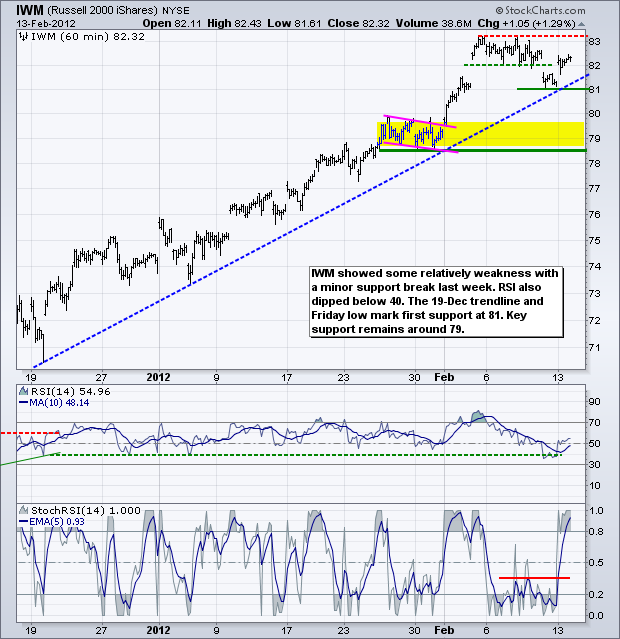
Is it turnaround Tuesday? Stocks are in uptrends, but way overbought and ripe for a corrective period. Small-caps (IWM) are lagging large-caps (SPY) the last 6-7 days and this is a sign of market fatigue. The Dollar is way oversold and ripe for a bounce, which could facilitate a stock market bounce. A bounce in the greenback could boost the 20+ Year T-Bond ETF (TLT) because treasuries and the Dollar are positively correlated. Gold is positively correlated to the stock market and negatively correlated to the Dollar, which means it may correct along with stocks. Even though oil just broke resistance, a bounce in the Dollar and correction in the stock market would likely be negative. Retail sales will be reported today. This is one of the more important economic reports because retail spending drives some two thirds of GDP. The short-term fate of the stock market could hang in the balance. There is not much change on the SPY chart as the ETF surged back above 135 on Monday. SPY broke resistance in the 133 area with a gap on 3-Feb. Broken resistance and the gap turned into support that held all last week. A break below 133 and RSI break below 40 would provide the first signs that a correction is underway. Such a correction could involve a period of sideways price action or a pullback. The 130 area marks the next support zone to watch.
**************************************************************************
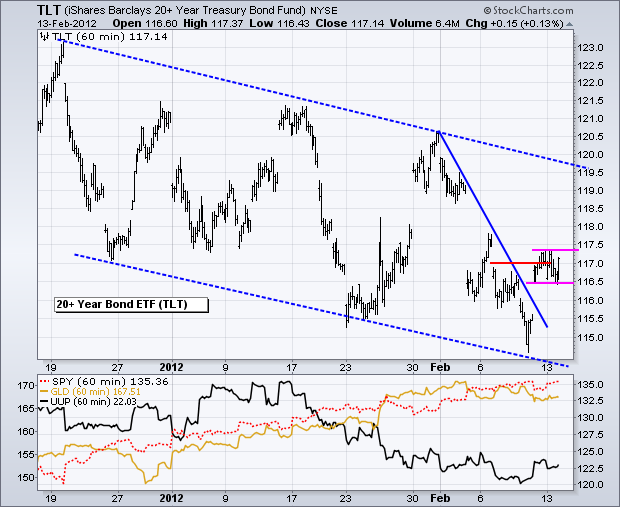
The 20+ Year T-Bond ETF (TLT) surged on Friday and then consolidated its gains on Monday. This is a bit strange because one would expect treasuries to decline when stocks and the Euro are strong. The consolidation looks like a flat flag of sorts and a break above Monday's high would signal a continuation higher. Even though this is an upswing within a bigger downtrend, the advance could extend to the 119-119.5 area, especially if the Dollar bounces.
**************************************************************************
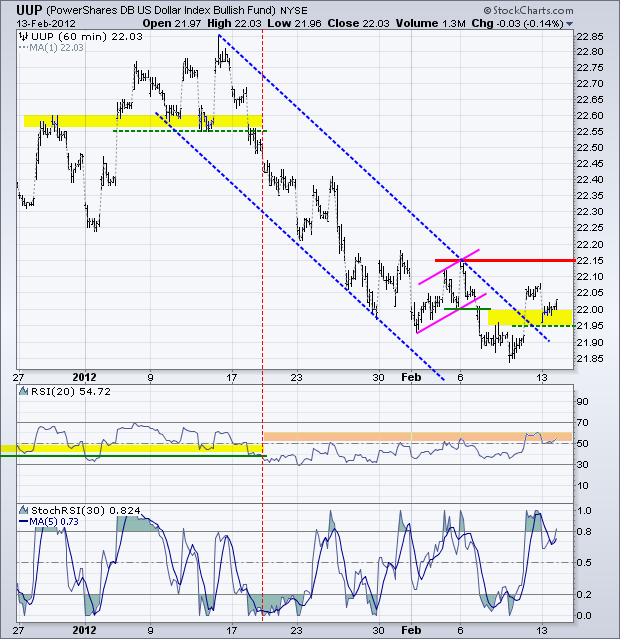
We could have a buy-the-rumor and sell-the-news scenario developing for the Euro. Traders bought the Euro heading into the Greek vote and could take profits now that the expected news is out. US Dollar Fund (UUP) remains in a downtrend, but broke above the channel trendline and held the break. With yesterday's low, UUP established a minor support level at 21.95 (call it 21.90 with a buffer). A follow through surge above key resistance at 22.15 would reverse this downtrend. RSI moved above 50 and held above 50. Look for a break above 60 to confirm a trend reversal.
**************************************************************************
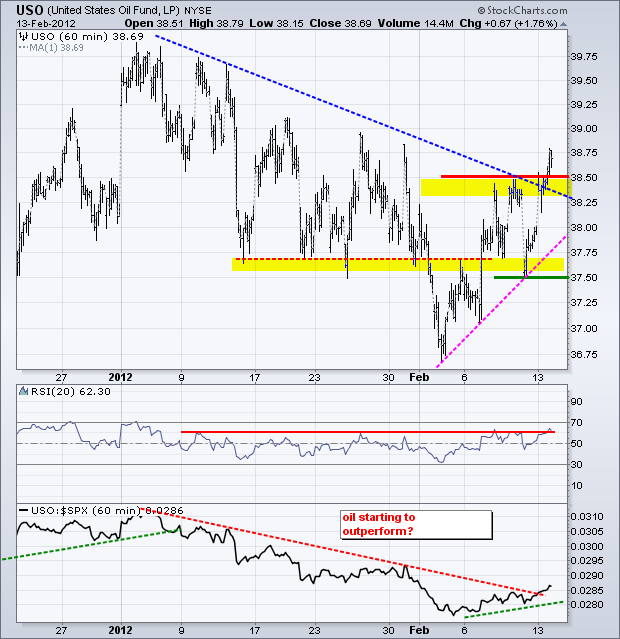
Stocks are overbought and ripe for a corrective period, while the Dollar is oversold and ripe for a bounce. This does not sound positive for oil, gold or other commodities. Just to keep it interesting, the US Oil Fund (USO) broke channel resistance with a surge above 38.50 on Monday. RSI moved above 60 for the second time in two weeks. Also note that oil has been outperforming the S&P 500 for over a week now. For now, I will mark a support zone in the 37.50-38.50 area and stay bullish until this breakout fails.
**************************************************************************
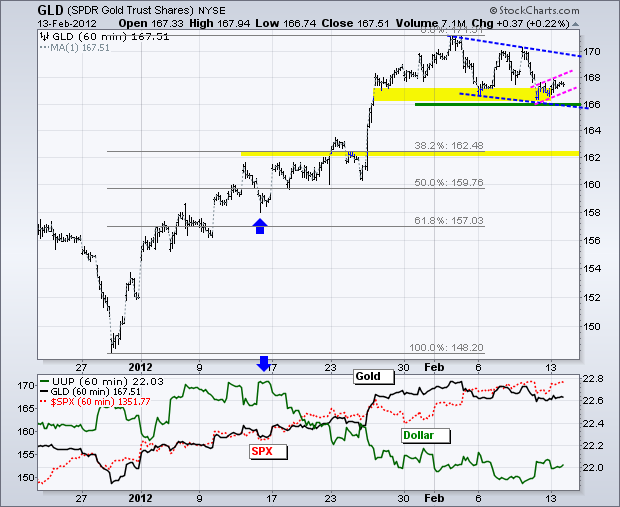
The Gold SPDR (GLD) moved to support and consolidated the last two days. A very small rising flag formed and a break below flag support would signal a continuation lower. This would project a support break at 166 and target a move to the 162 area. Should GLD hold support, watch for a surge and breakout at 170 to signal a continuation higher.
**************************************************************************
Key Economic Reports:
Tue - Feb 14 - 08:30 - Retail Sales
Tue - Feb 14 - 10:00 - Business Inventories
Wed - Feb 15 - 07:00 - MBA Mortgage Index
Wed - Feb 15 - 08:30 - Empire State Manufacturing
Wed - Feb 15 - 09:15 - Industrial Production
Wed - Feb 15 - 10:00 - NAHB Housing Market Index
Wed - Feb 15 - 10:30 - Oil Inventories
Wed - Feb 15 - 14:00 - FOMC Minutes
Thu - Feb 16 - 08:30 - Jobless Claims
Thu - Feb 16 - 08:30 - Housing Starts Building Permits
Thu - Feb 16 - 08:30 - Producer Price Index (PPI)
Thu - Feb 16 - 10:00 - Philadelphia Fed
Fri - Feb 17 - 08:30 - Consumer Price Index (CPI)
Fri - Feb 17 - 10:00 - Leading Indicators
Charts of Interest: Tuesday and Thursday in separate post.
This commentary and charts-of-interest are designed to stimulate thinking. This analysis is not a recommendation to buy, sell, hold or sell short any security (stock ETF or otherwise). We all need to think for ourselves when it comes to trading our own accounts. First, it is the only way to really learn. Second, we are the only ones responsible for our decisions. Think of these charts as food for further analysis. Before making a trade, it is important to have a plan. Plan the trade and trade the plan. Among other things, this includes setting a trigger level, a target area and a stop-loss level. It is also important to plan for three possible price movements: advance, decline or sideways. Have a plan for all three scenarios BEFORE making the trade. Consider possible holding times. And finally, look at overall market conditions and sector/industry performance.


