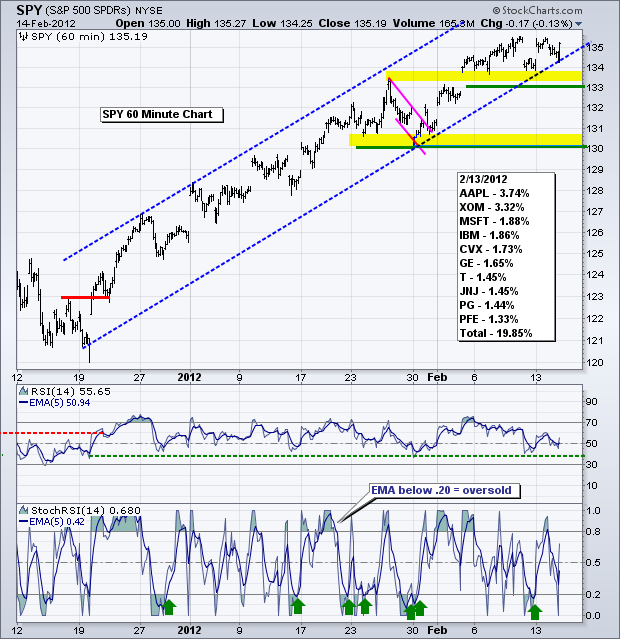
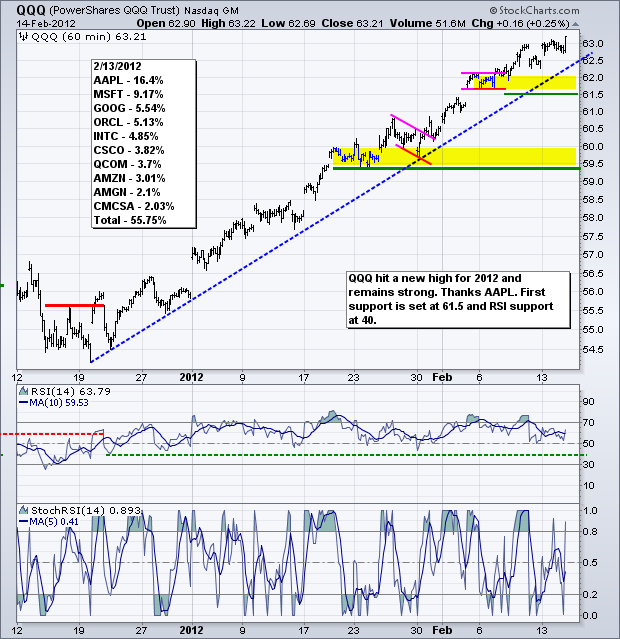
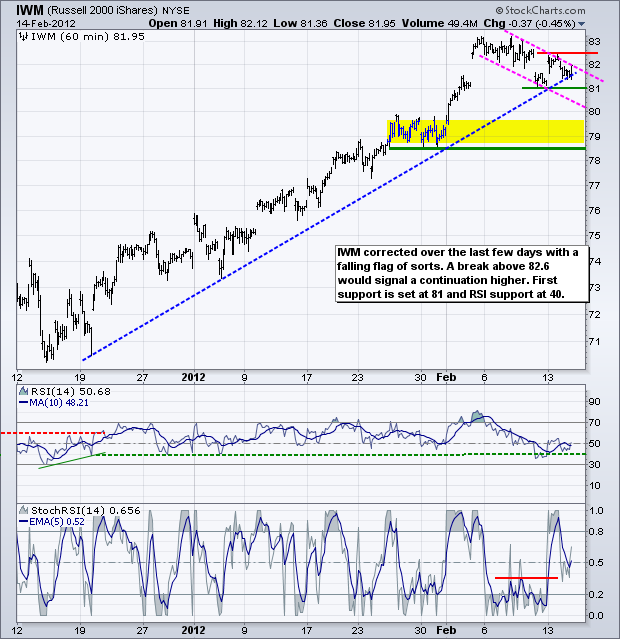
Stocks edged lower most of the day and then surged in the final 30 minutes. Even the smallest of dips brought out the bulls. I would hazard a guess that a fair amount of money missed this rally and some of it is on the sidelines waiting for a pullback. I would also hazard a guess that a wall-of-worry could also provide fuel. Stocks are still overbought and ripe for a correction, but this correction remains an elusive beast. On the whole, we have yet to see any significant signs of selling pressure or even a minor support break. With the late surge, the S&P 500 ETF (SPY) extended the consolidation within an uptrend. Broken resistance and the 3-Feb gap turned into support in the 133-134 area. This level has now held for eight trading days. A move below 133 and an RSI break below 40 would signal that a correction is taking shape. I am not sure how far it will extend because the bigger uptrend could pull trump at any time.
**************************************************************************
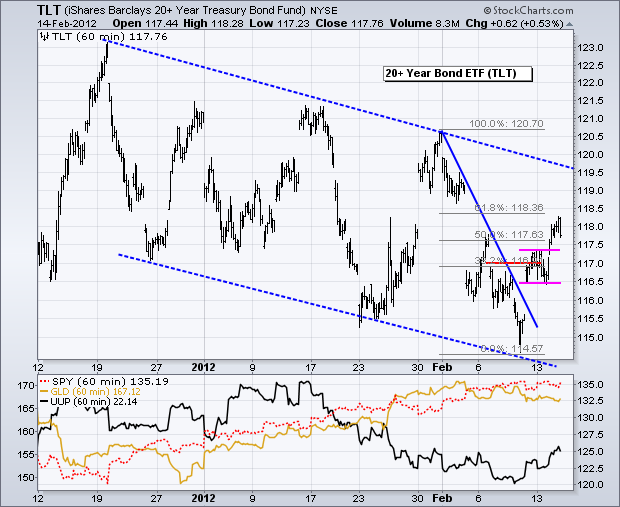
The 20+ Year T-Bond ETF (TLT) remains in a downtrend since 19-Dec, but the swing within this downtrend is up. TLT broke consolidation resistance with a surge above Monday's high and next resistance resides around 119-119.50. I am a bit wary of this rally because oil is breaking out and stocks remain strong. Strange days indeed. Note that the current upswing retraced 50-61.80% of the prior decline and could reverse course if stocks, the Euro and oil move higher.
**************************************************************************
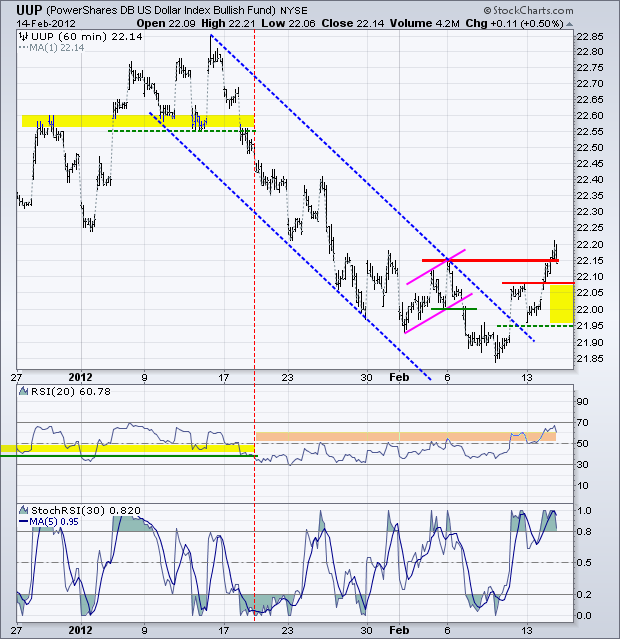
The US Dollar Fund (UUP) surged above key resistance and RSI broke above 60 to reverse the downtrend that has been in place since mid January. The breakout at 22.08 and Monday's low at 21.95 mark a support zone to watch on any pullback. Keep a close watch because the breakout is still quite fresh and UUP actually close below 22.15. A breakout in the Dollar is actually bullish for treasuries. Both are part of the risk-off trade, but we have yet to see a break down in stocks or a failed breakout in oil.
**************************************************************************
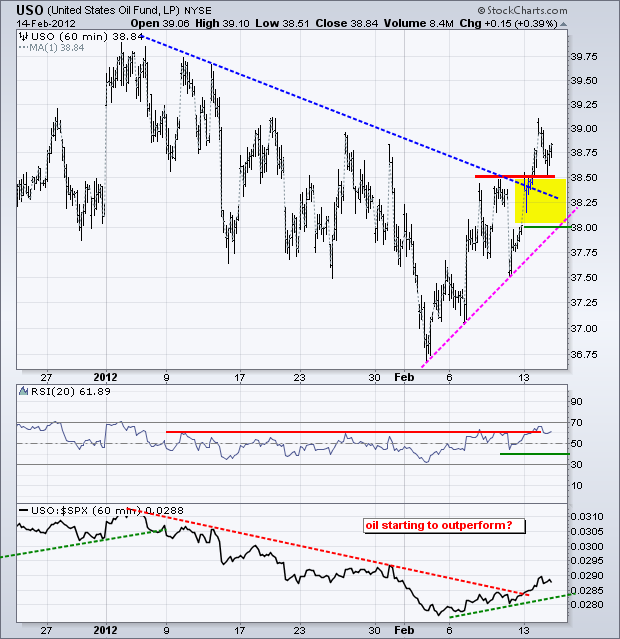
The US Oil Fund (USO) broke resistance at 38.50 and this breakout is largely holding. Broken resistance, Friday's close and the early February trendline combine to mark first support at 38. A move back below this level would negate the breakout. RSI broke above 60 to confirm the breakout. A move back below 40 would negate this momentum breakout.
**************************************************************************
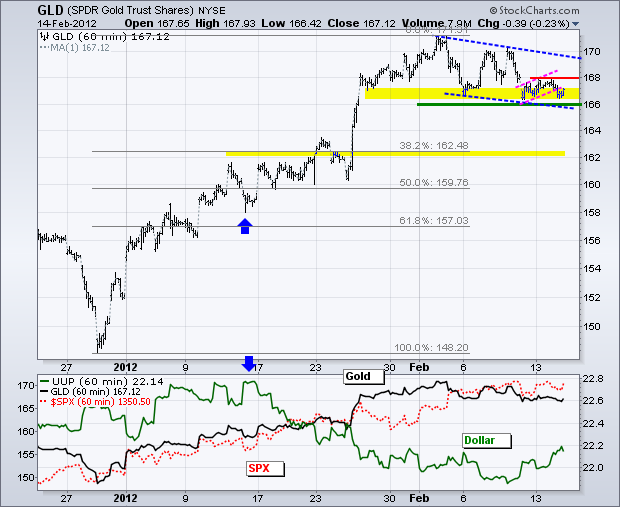
The Gold SPDR (GLD) broke support from the mini-flag, but held bigger support at 166 and surged in the final hour. Overall, a falling flag formed the last 2-3 weeks and resistance is set at 170. Within the flag, this week's high marks resistance at 168. A surge above this level would provide the first sign that gold is embarking on a bigger breakout. I will be watching the Dollar and stock market for clues too. A failed breakout in the Dollar and continued strength in the stock market would be positive for bullion.
**************************************************************************
Key Economic Reports:
Wed - Feb 15 - 07:00 - MBA Mortgage Index
Wed - Feb 15 - 08:30 - Empire State Manufacturing
Wed - Feb 15 - 09:15 - Industrial Production
Wed - Feb 15 - 10:00 - NAHB Housing Market Index
Wed - Feb 15 - 10:30 - Oil Inventories
Wed - Feb 15 - 14:00 - FOMC Minutes
Thu - Feb 16 - 08:30 - Jobless Claims
Thu - Feb 16 - 08:30 - Housing Starts Building Permits
Thu - Feb 16 - 08:30 - Producer Price Index (PPI)
Thu - Feb 16 - 10:00 - Philadelphia Fed
Fri - Feb 17 - 08:30 - Consumer Price Index (CPI)
Fri - Feb 17 - 10:00 - Leading Indicators
Charts of Interest: Tuesday and Thursday in separate post.
This commentary and charts-of-interest are designed to stimulate thinking. This analysis is not a recommendation to buy, sell, hold or sell short any security (stock ETF or otherwise). We all need to think for ourselves when it comes to trading our own accounts. First, it is the only way to really learn. Second, we are the only ones responsible for our decisions. Think of these charts as food for further analysis. Before making a trade, it is important to have a plan. Plan the trade and trade the plan. Among other things, this includes setting a trigger level, a target area and a stop-loss level. It is also important to plan for three possible price movements: advance, decline or sideways. Have a plan for all three scenarios BEFORE making the trade. Consider possible holding times. And finally, look at overall market conditions and sector/industry performance.


