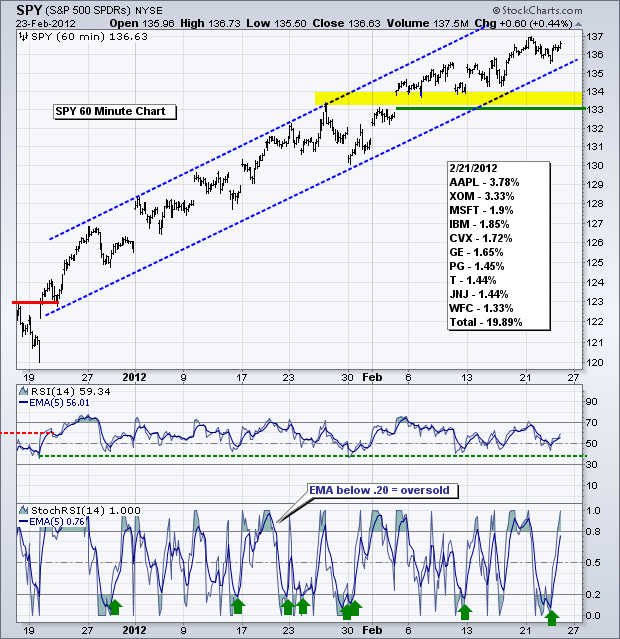
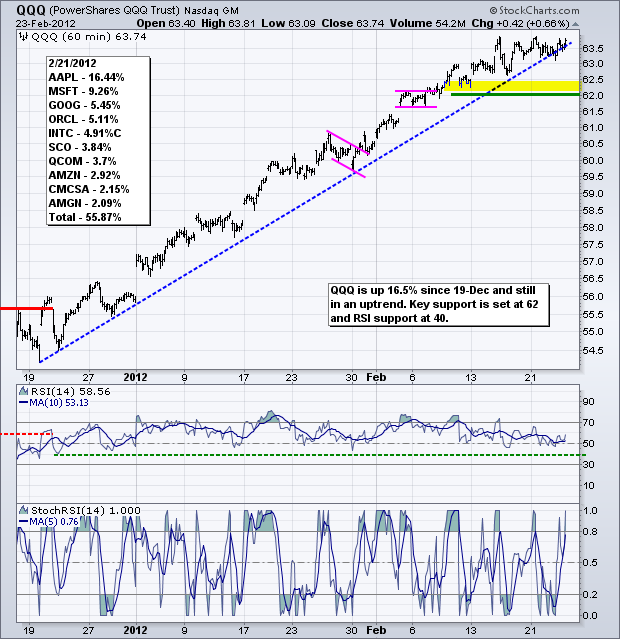
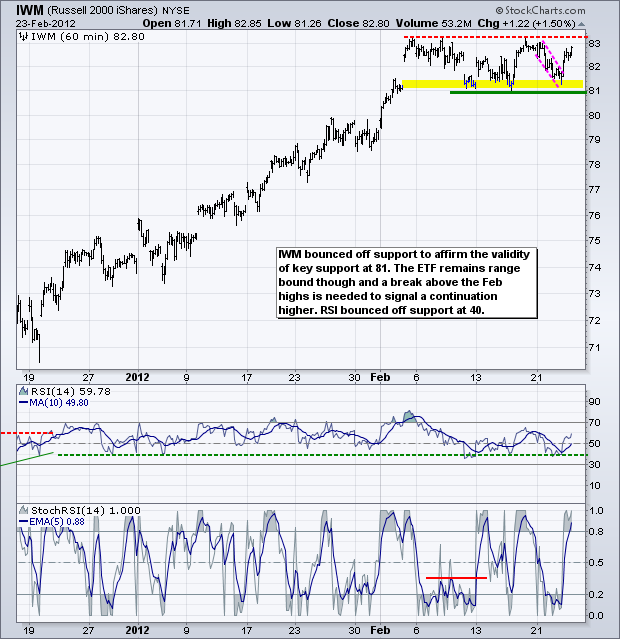
There are no major changes on the charts. However, yesterday was a bit strange because both treasuries and stocks moved higher. The 7-10 year T-Bond ETF (IEF) was up .14% and the S&P 500 ETF (SPY) was up .44%. Despite a day astray, stocks remains in clear uptrends and treasuries remain in clear downtrends. On the S&P 500 ETF (SPY) chart, broken resistance and the 3-Feb gap turn into the first support zone around 133-134. This level held the last two weeks as SPY edged higher with a zigzag above 136. RSI moved above 60 on 19-Dec and has held its bull zone (40-80) for nine weeks. This uptrend remains in place until SPY breaks 133 and RSI breaks 40.
**************************************************************************
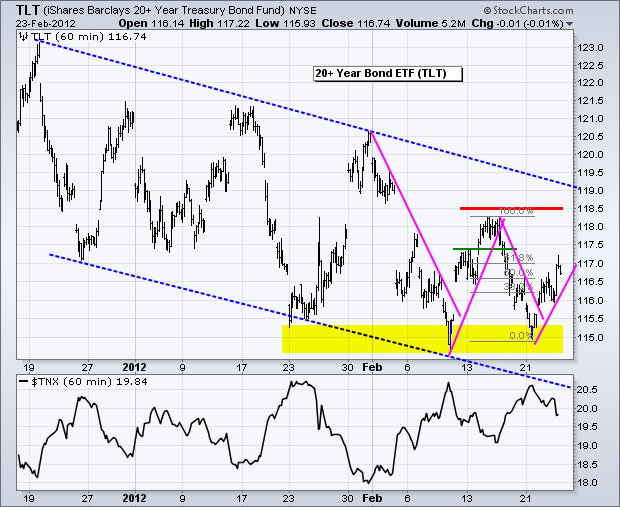
No change. There are several negative factors working against treasuries right now. We have strength in commodities, a firm Euro, a strong uptrend in stocks and strong economic reports the last few months. The 20+ Year T-Bond ETF (TLT) is in a clear downtrend with lower lows and lower highs since 19-Dec. The most recent bounce off support retraced 50-61.80% of the prior decline. At this point, I think it is a dead-cat bounce within a bigger downtrend and another test of the lows is likely. Key resistance remains at 118.50.
**************************************************************************
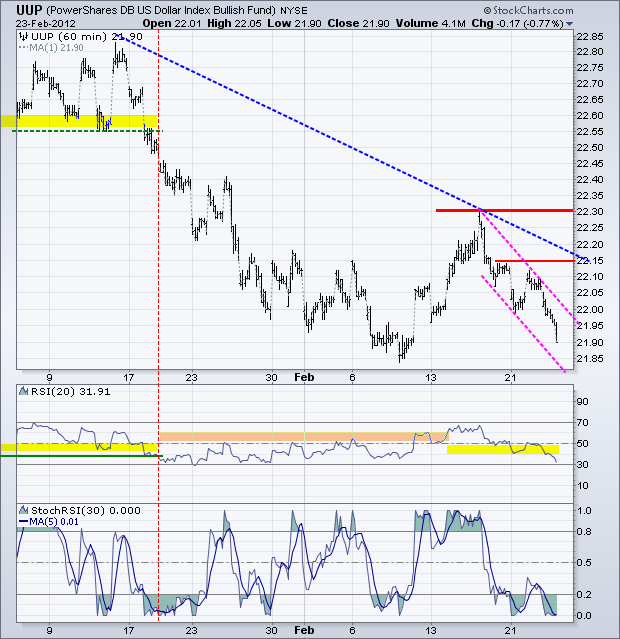
The US Dollar Fund (UUP) fell sharply on Wednesday and is heading for a test of the early February lows. I am not sure if these lows should be considered support because the trend since mid January is down. A falling channel formed the last five days with first resistance at 22.15. Key resistance is now set at 22.30. RSI broke below 40 and momentum favors the bears now.
**************************************************************************
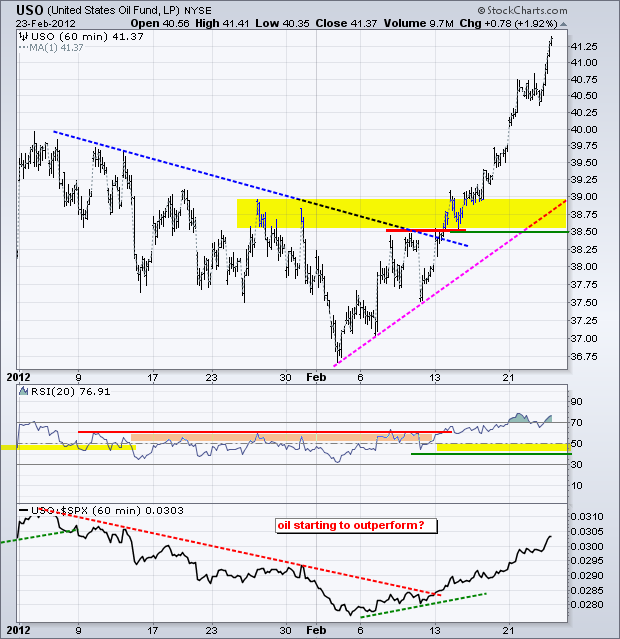
No change. Oil continues to surge with Brent Crude leading the global charge. The US Oil Fund (USO) broke resistance with a surge from 36.75 to 41.37 over the last three weeks. Oil is playing catch up with the stock market and also getting overbought, especially for the short-term. Note that the decline from early January to early February looks like a falling flag on the daily chart. The breakout at 38.50 signals a continuation of the December advance and broken resistance turns first support. RSI support is set at 40.
**************************************************************************
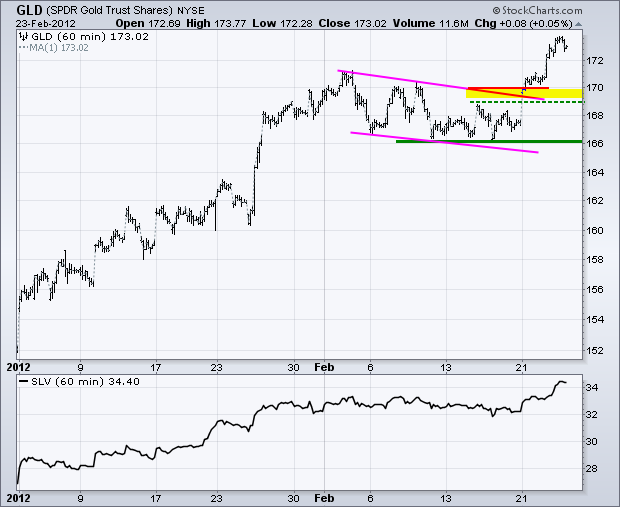
No change. Gold has spoken with a surge above 170 and a falling flag breakout. After a 3-4 week correction, this move signals a continuation of the prior advance, which began in late January, or perhaps even in late December. Either way, the breakout points to higher prices for bullion. The move reinforces key support at 166. Broken resistance in the 169-170 area turns into the first support zone. The only concern here is that a breakout in the Dollar could de-rail the breakout in gold.
**************************************************************************
Key Economic Reports:
Fri - Feb 24 - 09:55 - Michigan Sentiment
Fri - Feb 24 - 10:00 - New Home Sales
Wed - Feb 29 – 08:00 - Second LTRO round for EU Banks
Wed – Feb 29 – 08:00 – Italian bond auction
Charts of Interest: Tuesday and Thursday in separate post.
This commentary and charts-of-interest are designed to stimulate thinking. This analysis is not a recommendation to buy, sell, hold or sell short any security (stock ETF or otherwise). We all need to think for ourselves when it comes to trading our own accounts. First, it is the only way to really learn. Second, we are the only ones responsible for our decisions. Think of these charts as food for further analysis. Before making a trade, it is important to have a plan. Plan the trade and trade the plan. Among other things, this includes setting a trigger level, a target area and a stop-loss level. It is also important to plan for three possible price movements: advance, decline or sideways. Have a plan for all three scenarios BEFORE making the trade. Consider possible holding times. And finally, look at overall market conditions and sector/industry performance.

About the author:
Arthur Hill, CMT, is the Chief Technical Strategist at TrendInvestorPro.com. Focusing predominantly on US equities and ETFs, his systematic approach of identifying trend, finding signals within the trend, and setting key price levels has made him an esteemed market technician. Arthur has written articles for numerous financial publications including Barrons and Stocks & Commodities Magazine. In addition to his Chartered Market Technician (CMT) designation, he holds an MBA from the Cass Business School at City University in London.
Learn More
