Stocks edged lower on Wednesday as commodities moved higher. There is generally a positive correlation between stocks and commodities, including gold. The Dollar and commodities are generally negatively correlated, as are stocks and treasures. Even though intermarket relationships are important, my first focus is on the individual price charts because intermarket relationships can go astray from time to time. While many view gold as a safe-haven, it is also a currency alternative and many of the world's largest central banks are printing money. The Fed, Bank of England, the European Central Bank (ECB) and the Bank of Japan are all involved in quantitative easing of some sort. This dilutes their currencies and gives rise to currency alternatives, such as gold. With interest rates low, this liquidity is also fueling a rise in the equity markets. Yes, it is a classic liquidity rally. How long or far it will last is anyone's guess. We simply need to watch the actual price charts for clues.
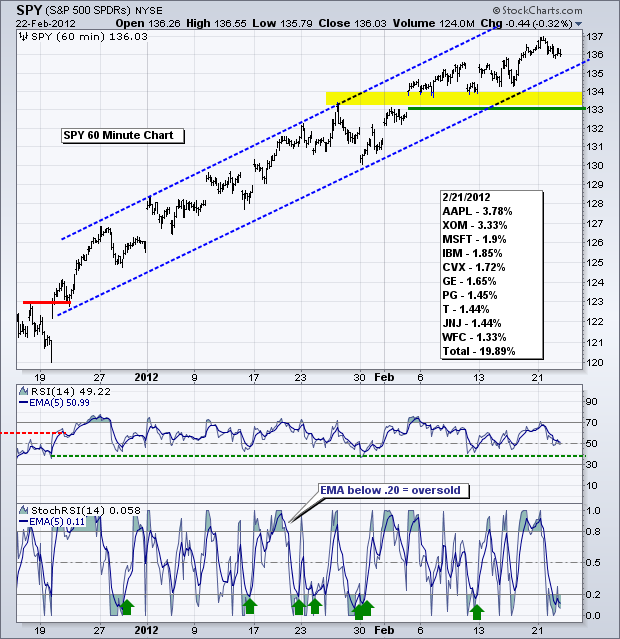
Turning to equities, stocks are certainly overbought and ripe for a correction, but we have yet to see any signs of significant selling pressure. Everyone is talking about the coming correction, but not enough people are actually selling. This means we may need some sort of blow-off top or buying climax to get pundits, off the correction subject. Short-term, broken resistance and the 3-Feb gap turn into the first support zone around 133-134. This level held the last two weeks as SPY edged higher with a zigzag above 136. RSI moved above 60 on 19-Dec and has held its bull zone (40-80) for nine weeks. This uptrend remains in place until SPY breaks 133 and RSI breaks 40.
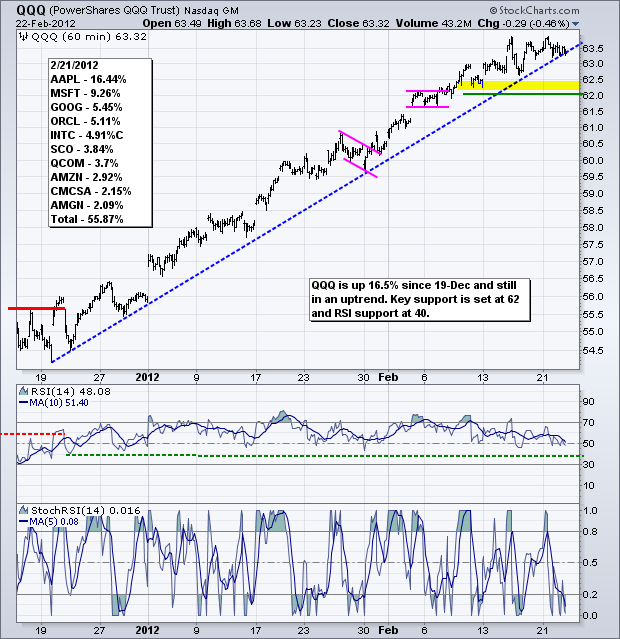
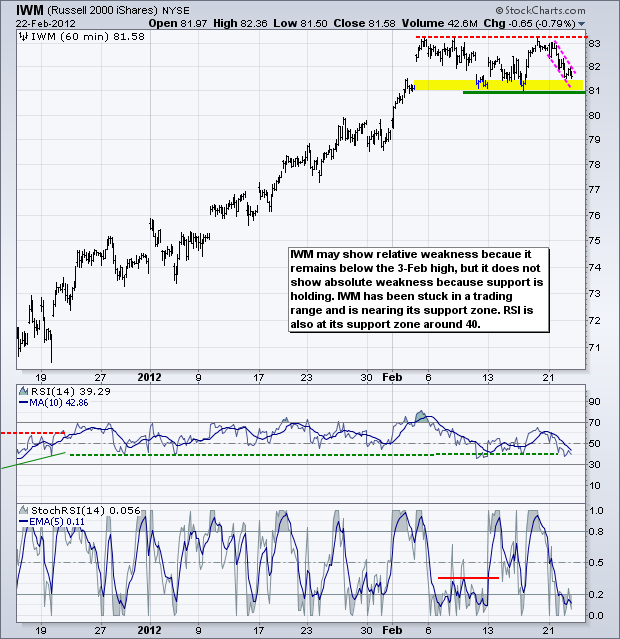
Note that the top ten components listed on the charts come from external websites. Holdings for QQQ can be found at invescopowershares.com and holdings for SPY can be found at spdrs.com, which are the main sites for these ETF families. I do not list them for IWM because the top ten holding account for less than 3% of the ETF.
**************************************************************************
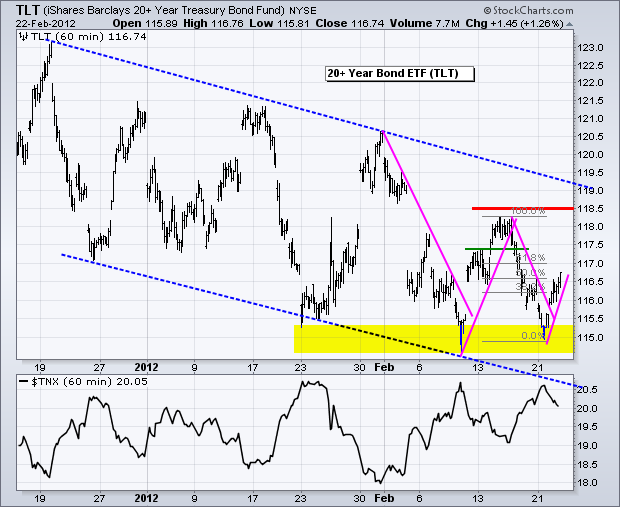
There are several negative factors working against treasuries right now. We have strength in commodities, a firm Euro, little weakness in stocks and strong economic reports the last few months. The 20+ Year T-Bond ETF (TLT) is in a clear downtrend with lower lows and lower highs since 19-Dec. Yesterday's bounce off support retraced 50-61.80% of the prior decline. At this point, I think it is a dead-cat bounce within a bigger downtrend and another test of the lows is likely. Key resistance remains at 118.50.
**************************************************************************
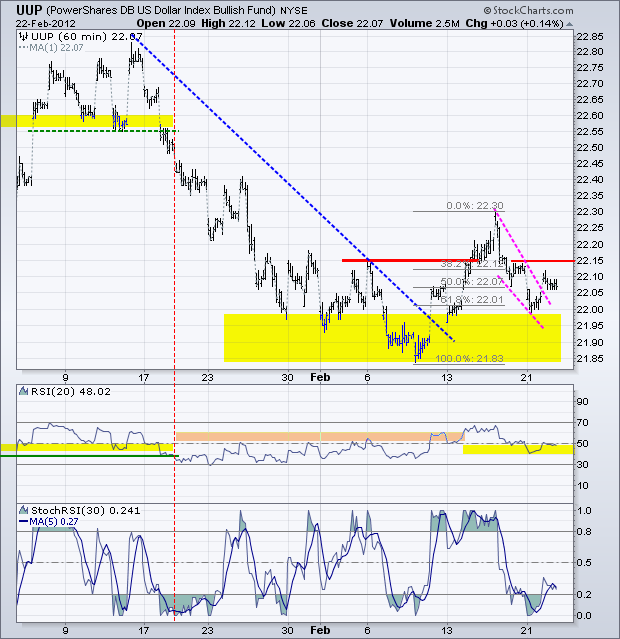
The US Dollar Fund (UUP) bounced on Wednesday, but did not break above first resistance at 22.15. Last week's upside breakout failed and the path of least resistance is down. A break back above 22.15 is needed to reverse this slide. RSI is testing its support zone in the 40-50 area and a move below 40 would put momentum back in bear mode.
**************************************************************************
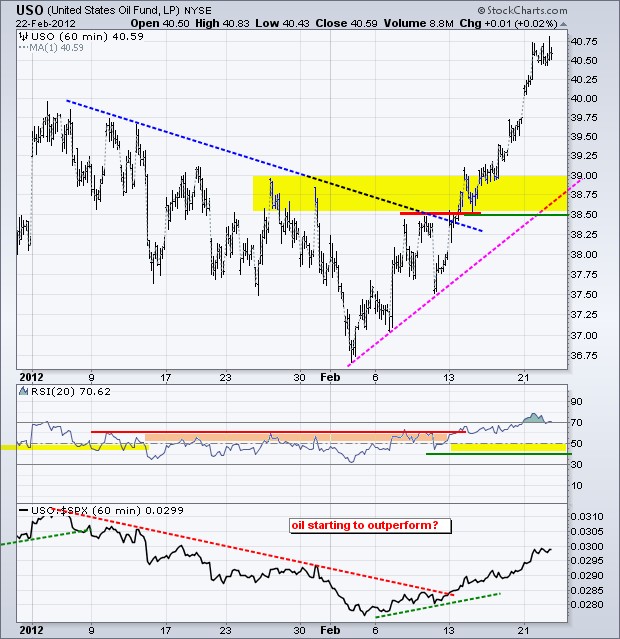
No change. Oil continues to surge with Brent Crude leading the global charge. The US Oil Fund (USO) broke resistance with a surge from 36.75 to 40.75 over the last three weeks. Oil is playing catch up with the stock market and also getting overbought, especially for the short-term. Note that the decline from early January to early February looks like a falling flag on the daily chart. The breakout at 38.50 signals a continuation of the December advance and broken resistance turns first support. RSI support is set at 40.
**************************************************************************
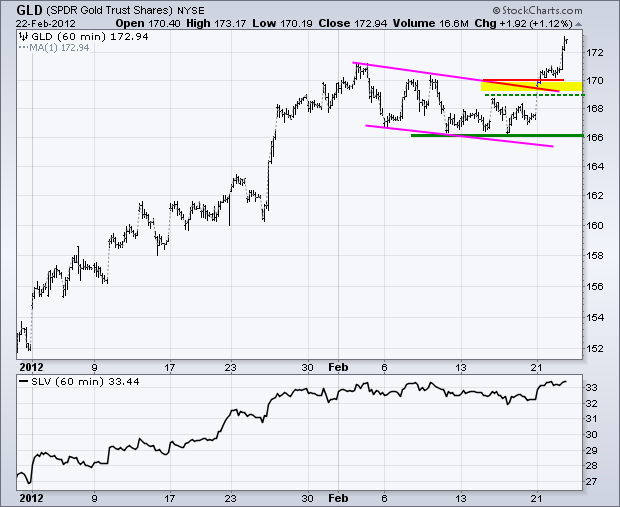
No change. Gold has spoken with a surge above 170 and a falling flag breakout. After a 3-4 week correction, this move signals a continuation of the prior advance, which began in late January, or perhaps even in late December. Either way, the breakout points to higher prices for bullion. The move reinforces key support at 166. Broken resistance in the 169-170 area turns into the first support zone. The only concern here is that a breakout in the Dollar could de-rail the breakout in gold.
**************************************************************************
Key Economic Reports:
Thu - Feb 23 - 08:30 - Jobless Claims
Thu - Feb 23 - 11:00 - Oil Inventories
Fri - Feb 24 - 09:55 - Michigan Sentiment
Fri - Feb 24 - 10:00 - New Home Sales
Wed - Feb 29 – 08:00 - Second LTRO round for EU Banks
Wed – Feb 29 – 08:00 – Italian bond auction
Charts of Interest: Tuesday and Thursday in separate post.
This commentary and charts-of-interest are designed to stimulate thinking. This analysis is not a recommendation to buy, sell, hold or sell short any security (stock ETF or otherwise). We all need to think for ourselves when it comes to trading our own accounts. First, it is the only way to really learn. Second, we are the only ones responsible for our decisions. Think of these charts as food for further analysis. Before making a trade, it is important to have a plan. Plan the trade and trade the plan. Among other things, this includes setting a trigger level, a target area and a stop-loss level. It is also important to plan for three possible price movements: advance, decline or sideways. Have a plan for all three scenarios BEFORE making the trade. Consider possible holding times. And finally, look at overall market conditions and sector/industry performance.

