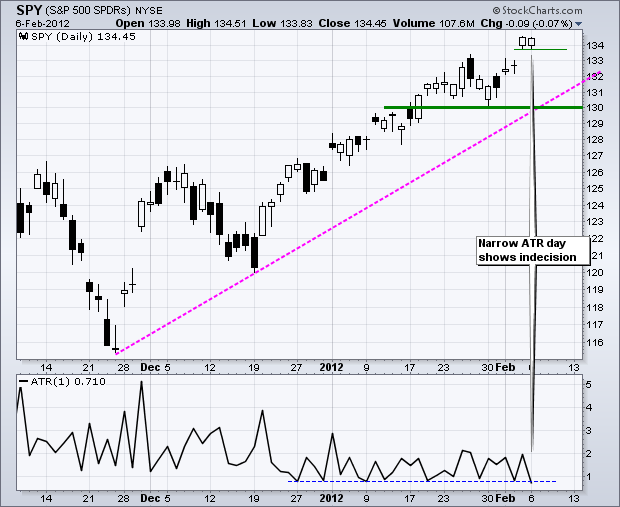
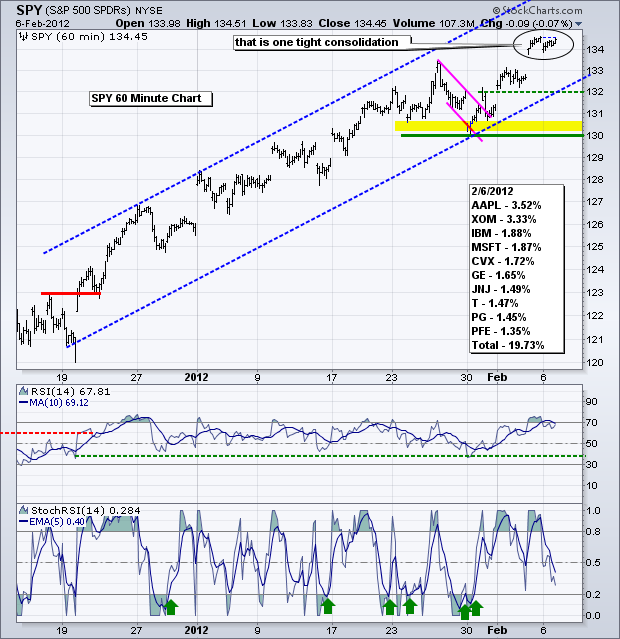
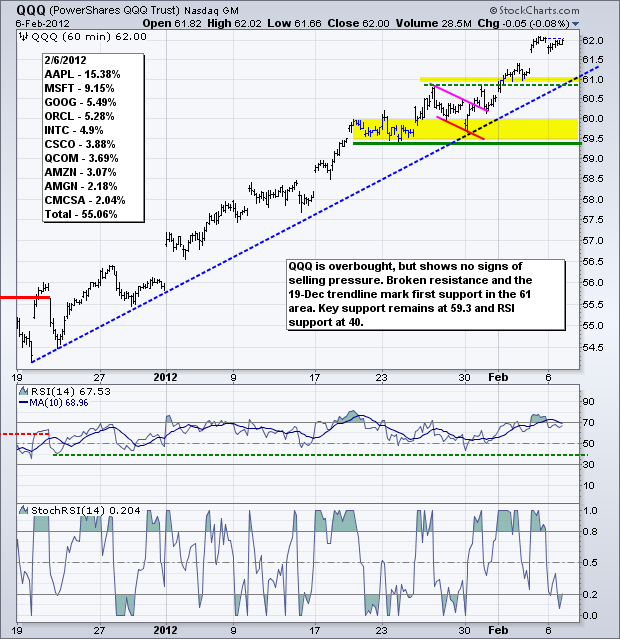
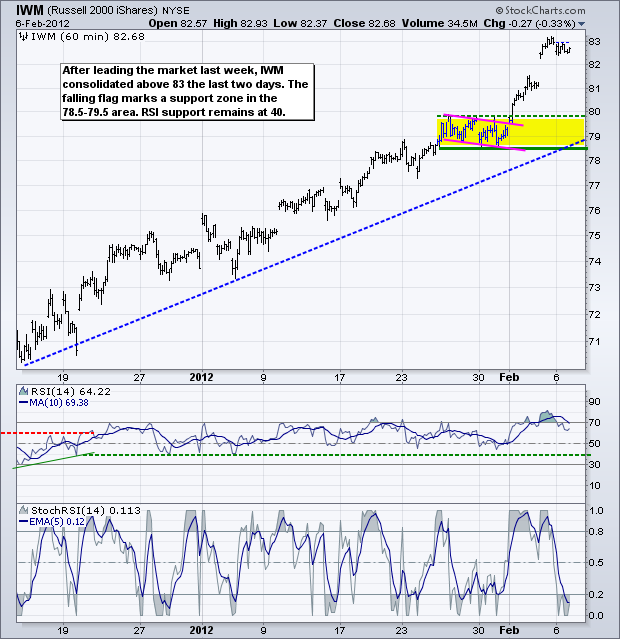
Today could be volatile. First, stocks are overbought after a seven week advance. Second, Bernanke testifies before Congress today. Third, Greek debt negotiations continue and Greek unions put out the call for a general strike on Tuesday. Fourth, the Euro is short-term overbought and consolidating, while the Dollar is short-term oversold and consolidating. I will be watching these consolidations for the first directional clues. Stocks opened weak, but immediately firmed and consolidated on Monday. In fact, stocks have been consolidating since Friday's gap higher. On the S&P 500 ETF (SPY) chart, yesterday's range was the narrowest in several months. StockCharts users can look at 1-day Average True Range (ATR) for an estimate of the day's range. On the daily SPY chart, 1-day ATR is at its lowest level in over six months. Such a narrow range shows indecision that can sometimes foreshadow a short-term reversal. I am not calling for a major reversal here and now. Just keep in mind that SPY is overbought and the low ATR reading shows indecision, which is the first step to a directional change. A move below yesterday's low would be the second baby-step to a reversal. Key support remains at 130 and RSI support at 40.
**************************************************************************
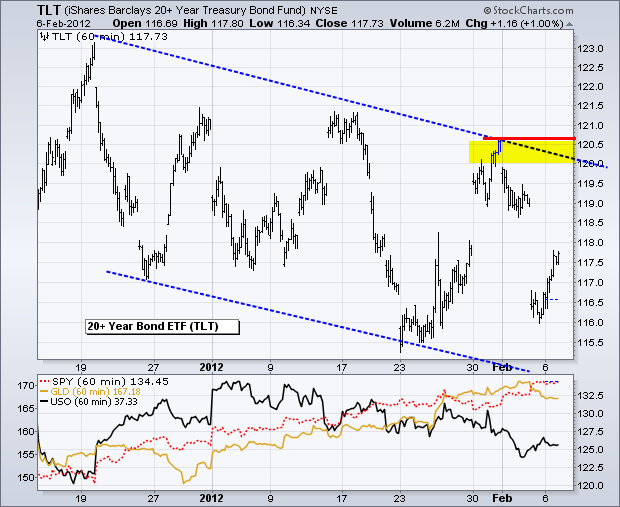
The 20+ Year T-Bond ETF (TLT) has been trending lower with a big zigzag down the last seven weeks. The counter trend rallies within this downtrend have been sharp, but each one formed a lower high and lower low. I am not ready to call Monday's oversold bounce a higher low just yet. Looking at the bigger picture, it is also worth noting that the chart since late October shows a sharp advance until mid December and then a falling flag consolidation. In other words, the big zigzag lower looks like a bull flag on the daily chart. Key resistance is set in the 120-120.5 area.
**************************************************************************
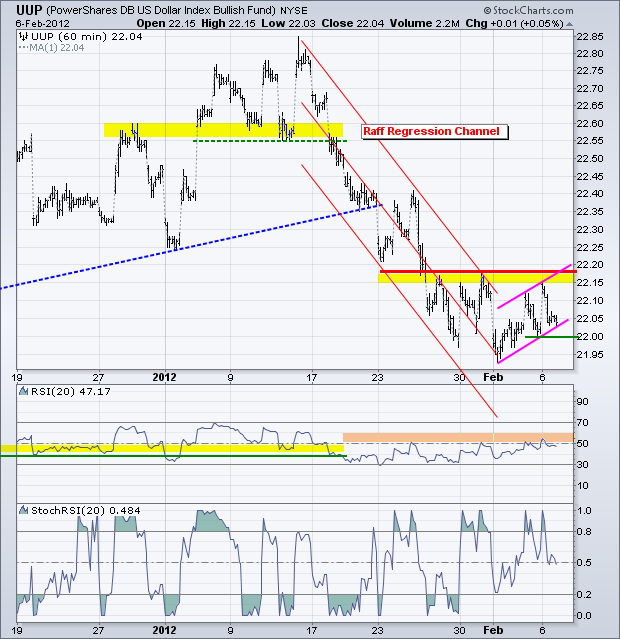
The US Dollar Fund (UUP) remains in a downtrend overall and the decline slowed as the ETF consolidated the last 7-8 days. As noted above, this could be a volatile week for the Euro, which in turn will directly affect the greenback. The advance this month looks like a rising flag and a break below 22 would be the early signal for a continuation lower. Key resistance remains at 22.20 and a break above this level is needed to reverse the downtrend. RSI resistance remains at 60.
**************************************************************************
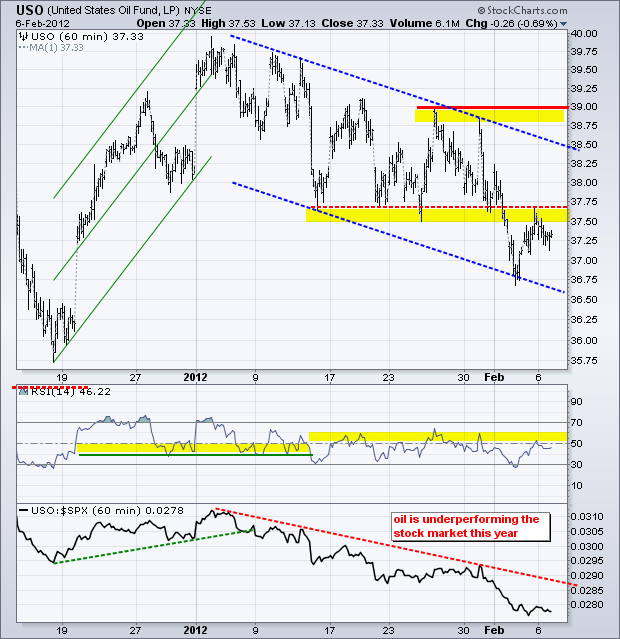
The US Oil Fund (USO) remains in a downtrend with lower lows and lower highs throughout 2012. Taking a step back, this decline looks like a falling flag on the daily chart and a break above 39 would signal a continuation of the late December surge. At this point, however, there are no signs of short-term strength that would suggest a bigger breakout is imminent. Broken support turns first resistance in the 37.75 area and RSI resistance remains at 60. Breaks above these levels would provide the first signs of strength.
**************************************************************************
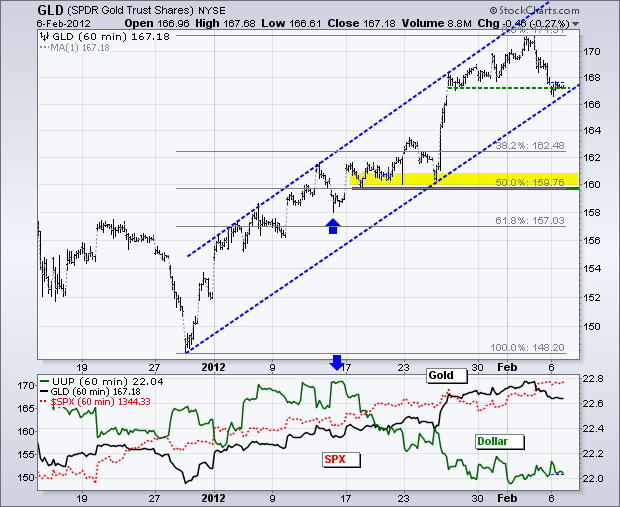
The Gold SPDR (GLD) remains in an uptrend as it tests support in the 167 area. Support here stems from the late December trendline and the late January lows. While a break would signal further weakness, I still view this as a correction within a bigger uptrend. The 160-162 area marks a significant support level that is defined by a 38-50% retracement of the entire advance and the mid January consolidation.
**************************************************************************
Key Economic Reports:
Tue - Feb 07 - 08:00 – Greek Debt Negotiations Continue
Tue - Feb 07 - 08:00 – General Strike in Greece
Tue - Feb 07 - 10:00 – Bernanke Testifies before Congress
Wed - Feb 08 - 07:00 - MBA Mortgage Index
Wed - Feb 08 - 10:30 - Oil Inventories
Thu - Feb 09 - 08:30 - Jobless Claims
Thu - Feb 09 - 08:00 – European Central Bank Policy Statement
Fri - Feb 10 - 09:55 - Michigan Sentiment
Charts of Interest: Tuesday and Thursday in separate post.
This commentary and charts-of-interest are designed to stimulate thinking. This analysis is not a recommendation to buy, sell, hold or sell short any security (stock ETF or otherwise). We all need to think for ourselves when it comes to trading our own accounts. First, it is the only way to really learn. Second, we are the only ones responsible for our decisions. Think of these charts as food for further analysis. Before making a trade, it is important to have a plan. Plan the trade and trade the plan. Among other things, this includes setting a trigger level, a target area and a stop-loss level. It is also important to plan for three possible price movements: advance, decline or sideways. Have a plan for all three scenarios BEFORE making the trade. Consider possible holding times. And finally, look at overall market conditions and sector/industry performance.


