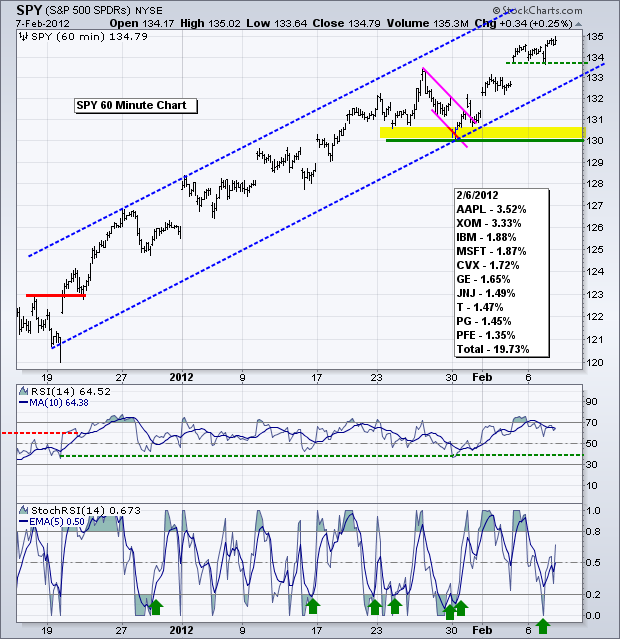
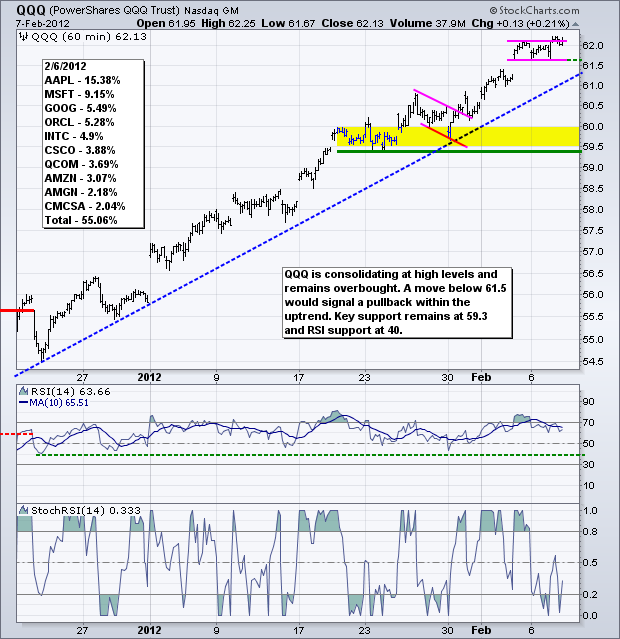
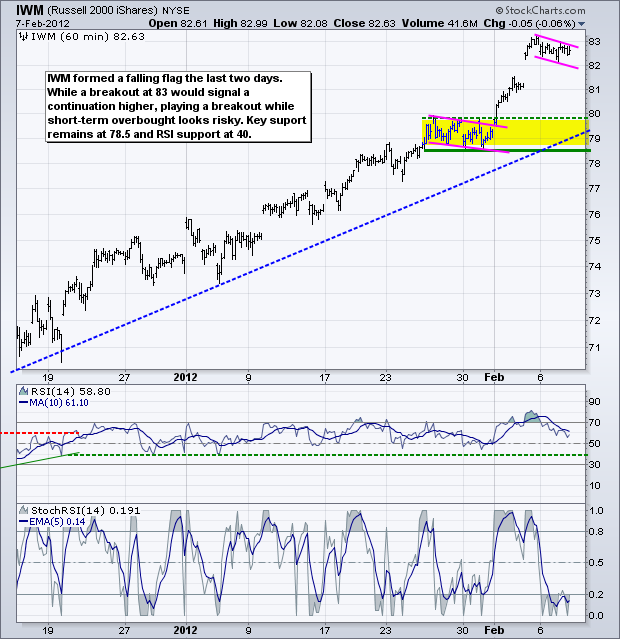
After a narrow day for Average True Range (ATR) indicator on Monday, stocks started the day weak on Tuesday, but quickly recovered and moved into positive territory. Even though stocks are overbought and ripe for a correction, selling pressure remains minimal and the bulls still reign supreme. SPY held support from the Friday-Monday lows and moved above 134.50 by the close on Tuesday. It is a small move that reinforces first support at 133.60. This is the first level to watch for a pullback within the short-term uptrend. Key support remains at 130-131 and RSI support at 40. Keep in mind that this uptrend has been in force since the breakout on December 19th. Picking tops or anticipating reversals within this uptrend has been a lesson in futility. Following the trend, on the other hand, has worked because a trend in motion stays in motion. As usual, I will wait for the market to tell me that the trend has reversed and resist from predicting a reversal.
**************************************************************************
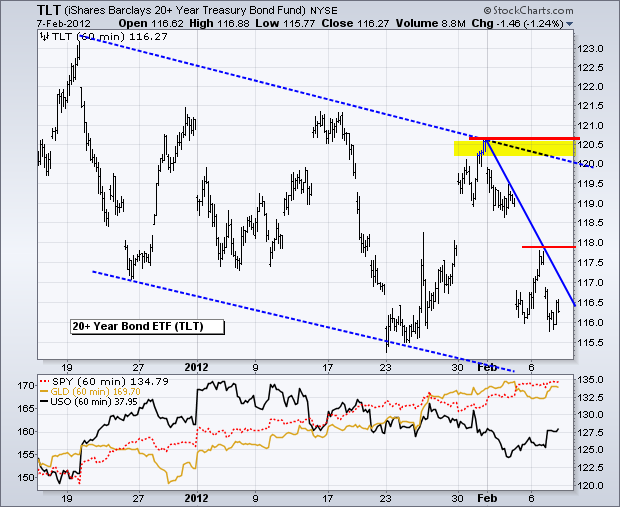
The 20+ Year T-Bond ETF (TLT) remains in a downtrend since 19-December with a big zigzag lower. While this pattern looks like a falling flag on the daily chart, we have yet to see a surge off the recent low that would suggest a bigger breakout is in the works. The February trendline and Monday's high mark the first resistance level to watch. Fundamentally, strength in stocks and a breakout in the Euro are bearish for treasuries, which are viewed as safe-havens and part of the risk-off trade.
**************************************************************************
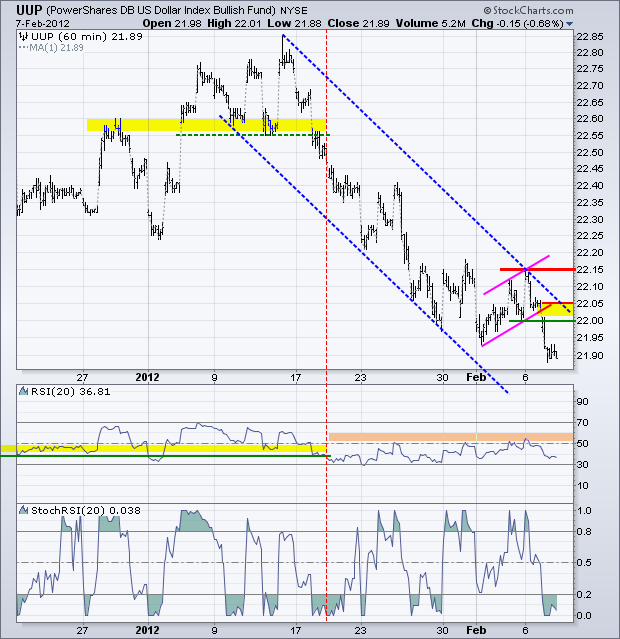
With another surge in the Euro, the US Dollar Fund (UUP) broke flag support and moved to a new low for the year (2012). Broken support and the mid January trendline combine to mark first resistance at 22.05. A surge back above this level would negate the flag breakdown. Key resistance is set at 22.15 and RSI resistance at 60. A move above these levels is needed to fully reverse the downtrend.
**************************************************************************
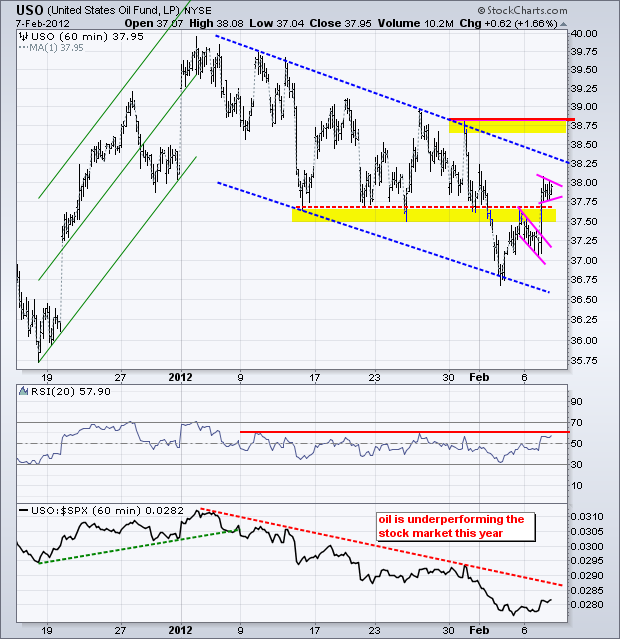
The US Oil Fund (USO) perked up on Tuesday with a move back above broken support. This is the early sign of strength that could lead to a bigger breakout. Note that the falling channel on the 60-minute chart looks like a falling flag on the daily chart. A break above 39 would signal a continuation of the late December advance. I made an adjustment to RSI. Instead of 14 periods, I am using 20 periods because this setting keeps RSI within the bearish range (20-60) during the entire downtrend. Notice how 20-period RSI failed at 60 twice during the 2012 downtrend. A break above 60 would turn momentum bullish.
**************************************************************************
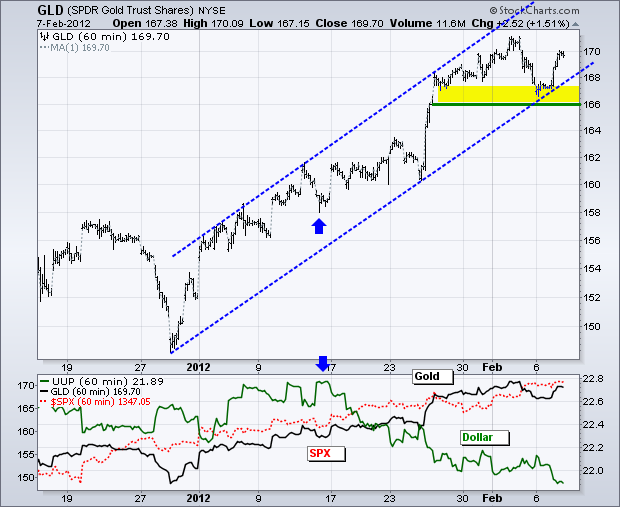
The Dollar and gold have been moving in opposite directions since January 13th. Tuesday was no exception as the Dollar plunged and gold surged. The Gold SPDR (GLD) bounced off the late December trendline to reinforce support in the 166-167 area. This level now becomes key short-term support.
**************************************************************************
Key Economic Reports:
Wed - Feb 07 - 08:00 – Greek Debt Negotiations Continue
Wed - Feb 08 - 07:00 - MBA Mortgage Index
Wed - Feb 08 - 10:30 - Oil Inventories
Thu - Feb 09 - 08:30 - Jobless Claims
Thu - Feb 09 - 08:00 – European Central Bank Policy Statement
Fri - Feb 10 - 09:55 - Michigan Sentiment
Charts of Interest: Tuesday and Thursday in separate post.
This commentary and charts-of-interest are designed to stimulate thinking. This analysis is not a recommendation to buy, sell, hold or sell short any security (stock ETF or otherwise). We all need to think for ourselves when it comes to trading our own accounts. First, it is the only way to really learn. Second, we are the only ones responsible for our decisions. Think of these charts as food for further analysis. Before making a trade, it is important to have a plan. Plan the trade and trade the plan. Among other things, this includes setting a trigger level, a target area and a stop-loss level. It is also important to plan for three possible price movements: advance, decline or sideways. Have a plan for all three scenarios BEFORE making the trade. Consider possible holding times. And finally, look at overall market conditions and sector/industry performance.

