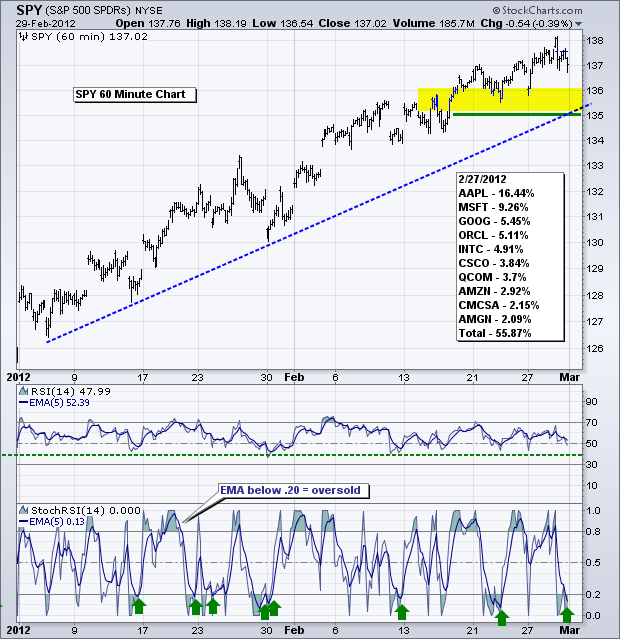
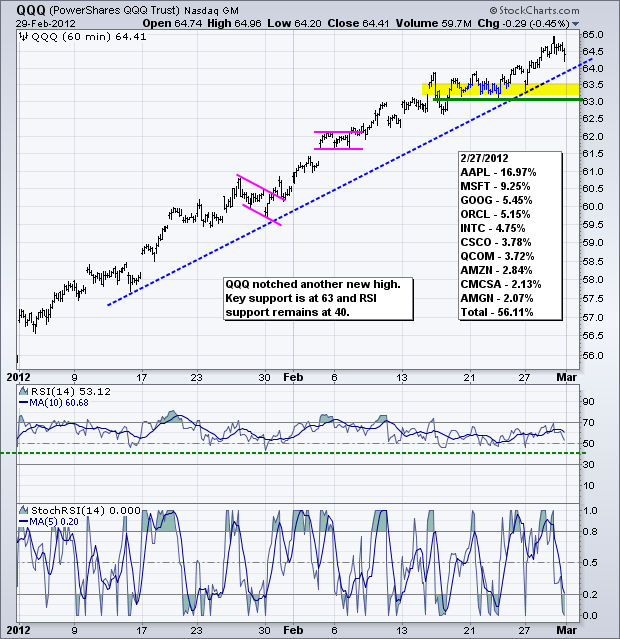
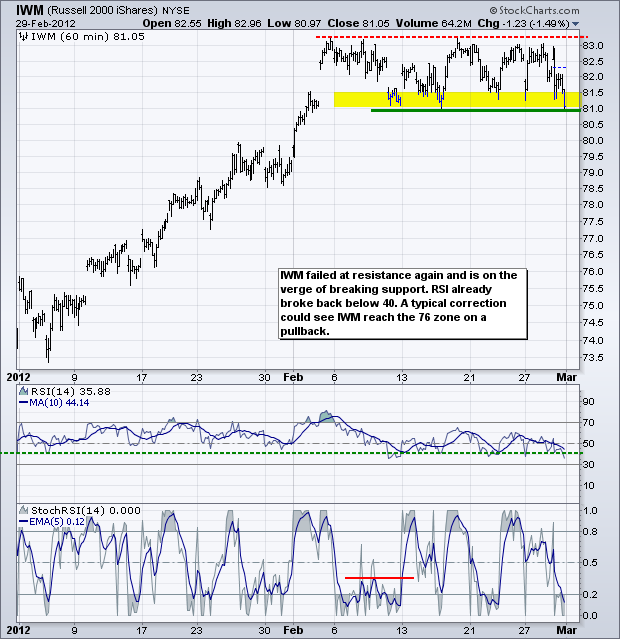
Stocks surged on the open with SPY and QQQ hitting new highs for the move, but promptly fell back and the major index ETFs closed with modest losses. Even though the opening gap-surge failed to hold, selling pressure was not that strong and the major index ETFs remain well above first support levels – except for IWM. Small-caps continue to underperform because IWM has yet to break its 3-Feb high and remains stuck in a consolidation. On the S&P 500 ETF (SPY) chart, I am raising key support to 135, which is based on the trendline extending up from the early January low, broken resistance and the lows of the last two weeks. Key support means this level holds the "key" to the short-term uptrend. A break below would reverse this uptrend and call for lower prices. SPY and QQQ have been moving higher the last 11 weeks and we have yet to see a decent correction or pullback. I am, therefore, concerned that there could be a sizable bounce after the first support break. For example, SPY could break 135 and then bounce into the 136-137 zone after this breakout.
**************************************************************************
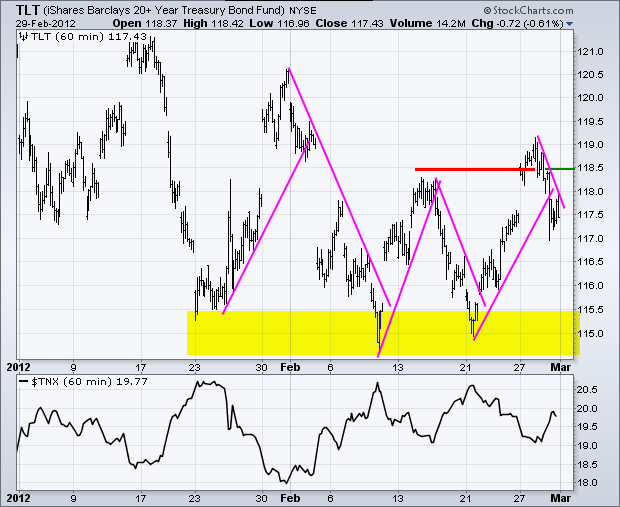
The 20+ Year T-Bond ETF (TLT) fell back rather hard the last two days. Chairman Bernanke gave treasuries a negative push when he failed to hint at a further round of quantitative easing. The Fed is by no means talking hawk, but has moved more towards the neutral camp and this suggest that the economy is doing fairly well. A less accommodating Fed and stronger economy could be negative for treasuries. TLT broke swing support and I am now marking first resistance at 118.50 again.
**************************************************************************
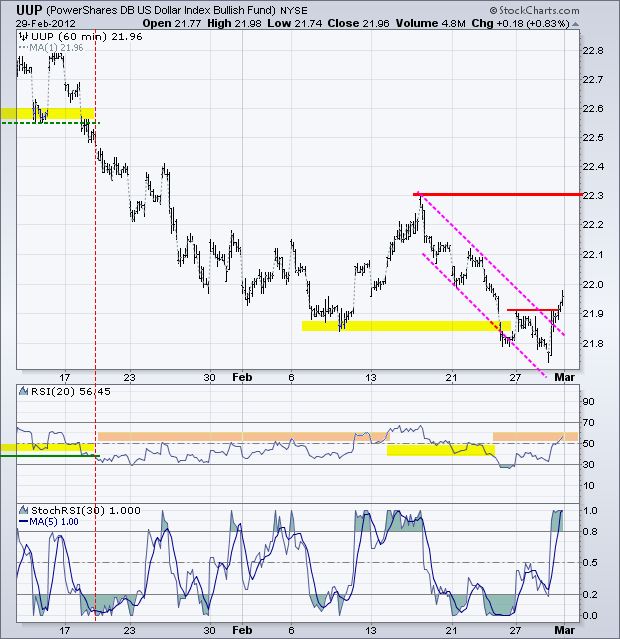
The US Dollar Fund (UUP) opened weak and closed strong to firm a bullish engulfing on the daily chart. Note that this pattern also formed at the 61.80% retracement. On the 60-minute chart UUP broke first resistance with a surge above 21.95 and the swing within the bigger downtrend is up. RSI moved into the 50-60 zone. Further strength would confirm the bullish engulfing and push RSI into bull mode (>60). Key resistance remains at 22.30 for now.
**************************************************************************
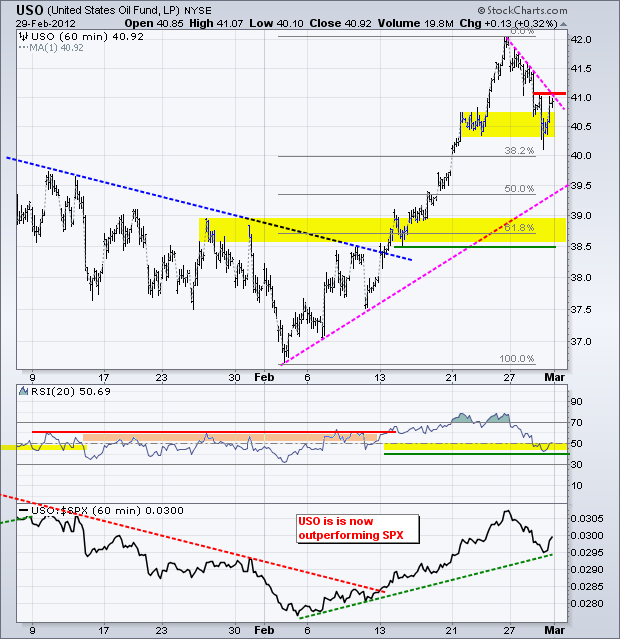
The US Oil Fund (USO) remains in corrective mode after a sharp decline the last three days. I am marking first resistance at 41.10. Follow through above this level would be positive, but I would also watch the stock market and the Dollar. Further weakness in stocks and strength in the Dollar could weigh on oil. The 50% retracement line and February trendline mark next support in the 39.50 area.
**************************************************************************
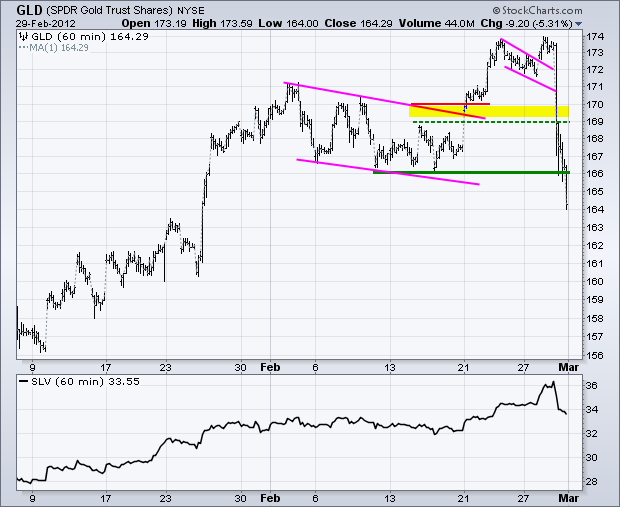
The Gold SPDR (GLD) failed to hold the small flag breakout and the big flag breakout. GLD plunged below first support at 169 and key support at 166. Perhaps the move is overblown because spot gold finished near the mid February lows and is trading around $1717 as I write (up ±20). The 170 zone marks support for spot gold. Even though Wednesday's decline could be an overreaction, it does show how fragile the gold rally was. The February gains were more than wiped out in just one day. This is not a good sign.
**************************************************************************
Key Economic Reports:
Thu - Mar 01 - 08:30 - Jobless Claims
Thu - Mar 01 - 08:30 - Personal Income & Spending
Thu - Mar 01 - 10:00 – ISM Manufacturing Index
Thu - Mar 01 - 10:00 - Construction Spending
Thu - Mar 01 - 14:00 - Auto & Truck Sales
Charts of Interest: Tuesday and Thursday in separate post.
This commentary and charts-of-interest are designed to stimulate thinking. This analysis is not a recommendation to buy, sell, hold or sell short any security (stock ETF or otherwise). We all need to think for ourselves when it comes to trading our own accounts. First, it is the only way to really learn. Second, we are the only ones responsible for our decisions. Think of these charts as food for further analysis. Before making a trade, it is important to have a plan. Plan the trade and trade the plan. Among other things, this includes setting a trigger level, a target area and a stop-loss level. It is also important to plan for three possible price movements: advance, decline or sideways. Have a plan for all three scenarios BEFORE making the trade. Consider possible holding times. And finally, look at overall market conditions and sector/industry performance.

