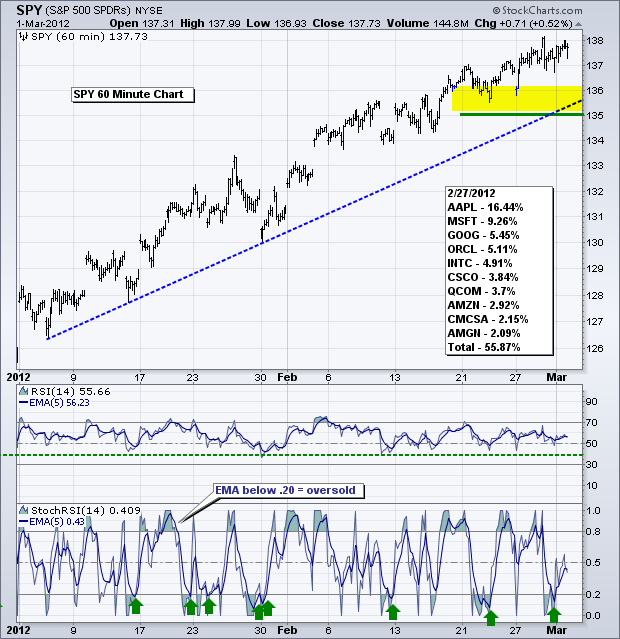
The S&P 500 ETF (SPY) remains in an uptrend as buying pressure continues to outpace selling pressure. This is clear by the succession of higher highs and higher lows since December 19th. Even though this uptrend is overextended and ripe for a correction, there are simply no signs of significant selling pressure or weakness on the price chart. Key support remains at 135 and RSI support at 40.
**************************************************************************
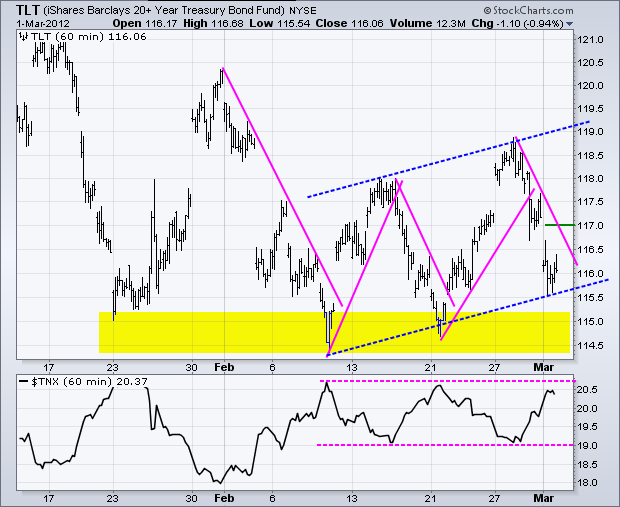
The 20+ Year T-Bond ETF (TLT) has been zigzagging higher since the first week of February (blue trendlines). The swing within this zigzag remains down with first resistance at 117. A break above this level would reverse the downswing and resume the zigzag higher. Taking a step back, TLT declined from 120 to 114.5 and then formed the zigzag higher. Is this a rising flag type move? A support break would be bearish and open the door to lower treasury prices (higher yields). The indicator window shows the 10-year Treasury Yield ($TNX) near resistance.
**************************************************************************
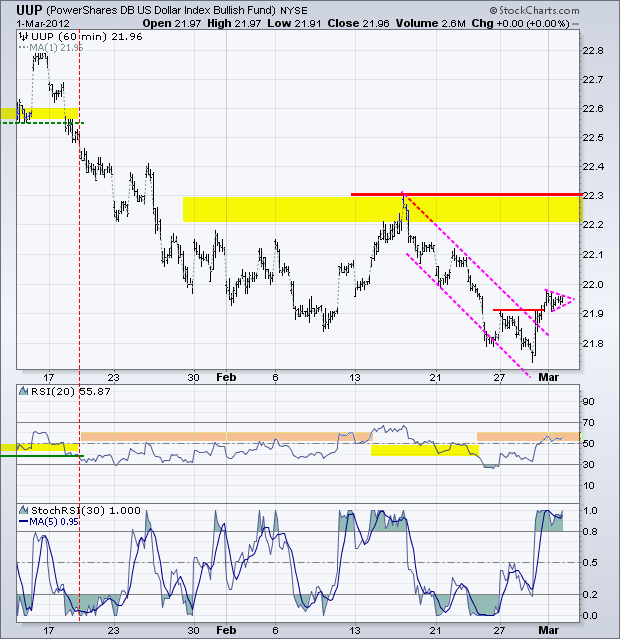
The US Dollar Fund (UUP) broke channel resistance with a big move on Wednesday and then consolidated above the breakout on Thursday. This consolidation looks like a small pennant, a break of which would signal a continuation higher. Such a breakout would most likely lead to an RSI breakout at 60. The next resistance zone resides in the 22.20-22.30 area.
**************************************************************************
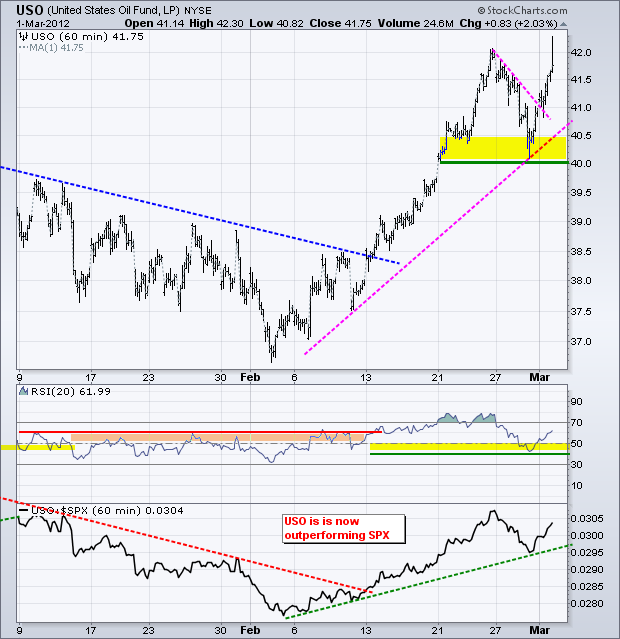
The US Oil Fund (USO) surged above minor resistance on rumors of a Saudi pipeline explosion. USO moved above 42, but the rumors were denied and oil fell back by the close. USO remains in an uptrend overall and I am setting key support at 40 for now. RSI bounced off the 40-50 zone and momentum remains bullish as long as 40 holds.
**************************************************************************
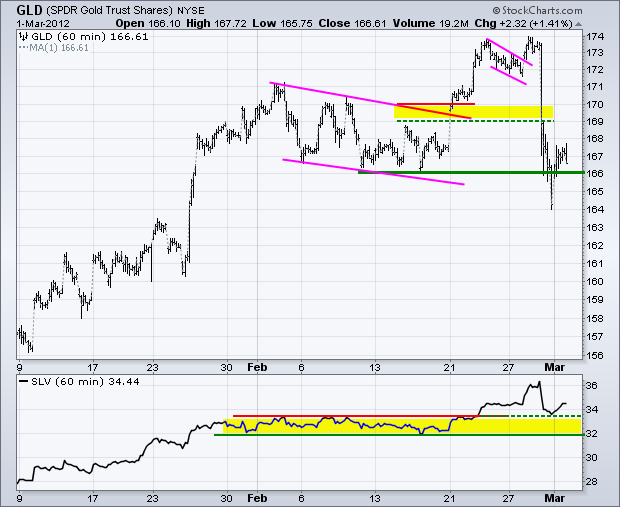
With the Dollar perking up and stocks overextended, gold could be in for a rough time. After strong selling pressure on Wednesday, the Gold SPDR (GLD) firmed around the February lows on Thursday. Key support remains at 166 and a break below this level would be bearish. Such a move would signal the inability to bounce and a resumption of selling pressure. The next target would be around 160.
**************************************************************************
Key Economic Reports:
Fri - Mar 02 - 08:00 - TGIF
Charts of Interest: Tuesday and Thursday in separate post.
This commentary and charts-of-interest are designed to stimulate thinking. This analysis is not a recommendation to buy, sell, hold or sell short any security (stock ETF or otherwise). We all need to think for ourselves when it comes to trading our own accounts. First, it is the only way to really learn. Second, we are the only ones responsible for our decisions. Think of these charts as food for further analysis. Before making a trade, it is important to have a plan. Plan the trade and trade the plan. Among other things, this includes setting a trigger level, a target area and a stop-loss level. It is also important to plan for three possible price movements: advance, decline or sideways. Have a plan for all three scenarios BEFORE making the trade. Consider possible holding times. And finally, look at overall market conditions and sector/industry performance.

About the author:
Arthur Hill, CMT, is the Chief Technical Strategist at TrendInvestorPro.com. Focusing predominantly on US equities and ETFs, his systematic approach of identifying trend, finding signals within the trend, and setting key price levels has made him an esteemed market technician. Arthur has written articles for numerous financial publications including Barrons and Stocks & Commodities Magazine. In addition to his Chartered Market Technician (CMT) designation, he holds an MBA from the Cass Business School at City University in London.
Learn More
