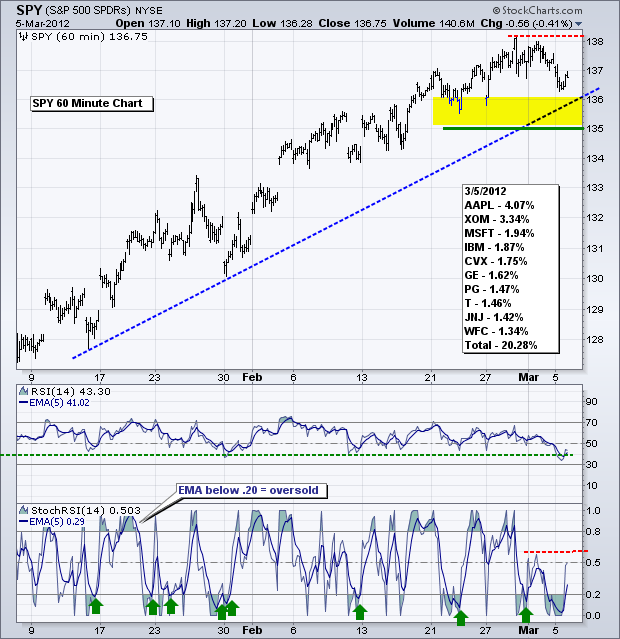
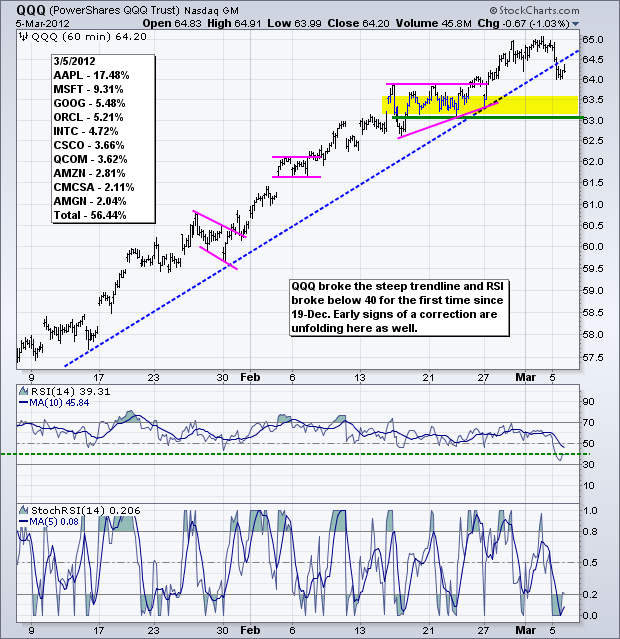
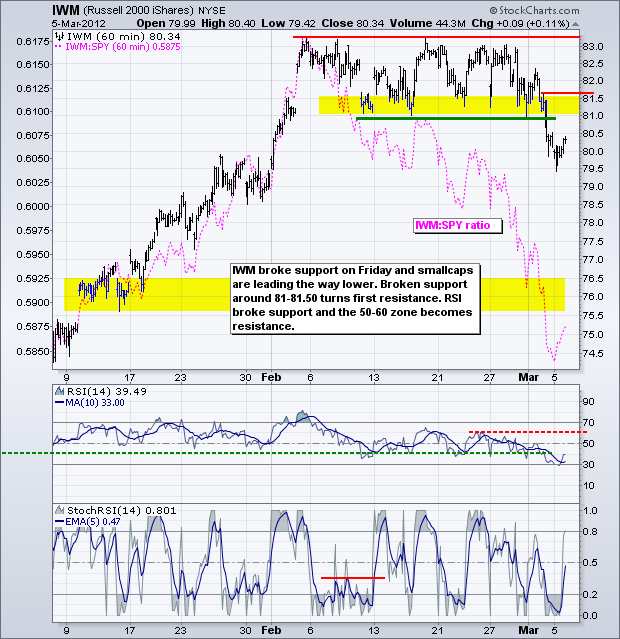
The S&P 500 ETF (SPY) dipped below 137 on Monday. While this is still viewed as a correction within an uptrend, note that RSI dipped to its lowest level since mid December. StochRSI also dipped below .20 twice and failed to break back above the resistance zone (.50-.60). These are early signs that a corrective process is beginning. Corrections are unfolding in a number of key ETFs already. The Russell 2000 ETF (IWM) broke down last week, the Transport iShares (IYT) has been lagging for a few weeks and the Semiconductor HOLDRS (SMH) broke support on Monday. Even though the chances of an extended correction are high, keep in mind that many a bull remains on the sidelines and dips could produce sharp bounces. This is why corrections sometimes evolve as choppy sideways patterns or choppy declines. Also keep in mind that the employment report is Friday.
**************************************************************************
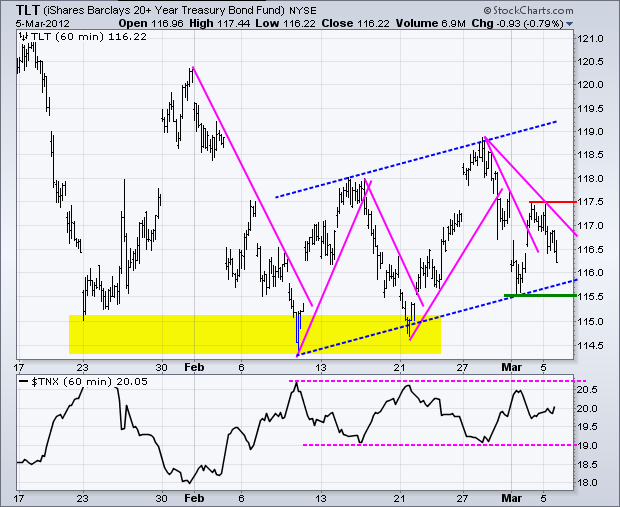
The 20+ Year T-Bond ETF (TLT) surged above the downswing trendline late last week, but pulled back rather sharply the last two days. Even so, the trend since 9-Feb is up as the ETF zigzags higher. The mid February trendline and last week's low mark support at 115.50. Treasuries are dependent on three things this week: stock market direction, the Greek tragedy and non-farm payrolls. Stocks and treasuries are negatively correlated and will move in opposite directions. Greek debt holders must accept or reject the terms of their haircut by Thursday. Any negative news on the Euro could trigger a flight-so-safety. Treasuries are negatively correlated to non-farm payrolls. A better-than-expected report would be bearish for treasuries. A worse-than-expected report would be bullish.
**************************************************************************
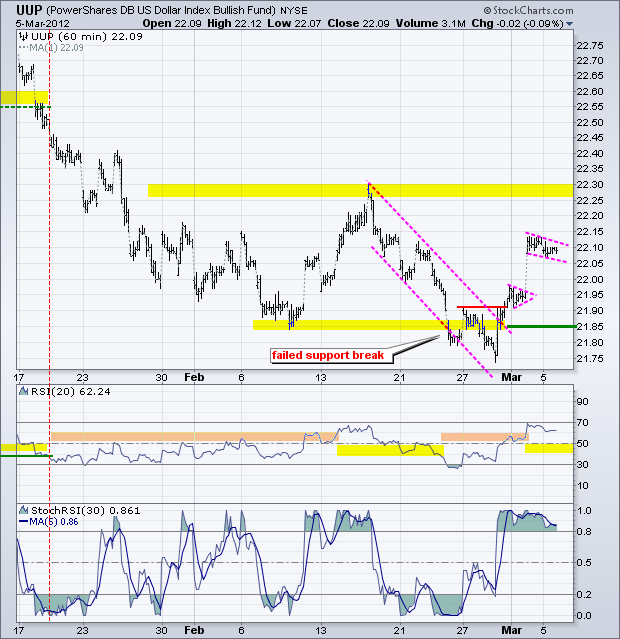
The US Dollar Fund (UUP) surged and consolidated again. This time a high-tight flag formed and a break above 22.15 would open the door to the mid February high. RSI broke above 60 with last week's surge and momentum remains in bull mode. RSI support is now set at 40. Price chart support remains at 21.85 for now. The Euro will be in focus the next few days as Greek debt holders accept or reject the terms of their haircut. Rejection would push Greece closer to default and could weigh on the Euro.
**************************************************************************
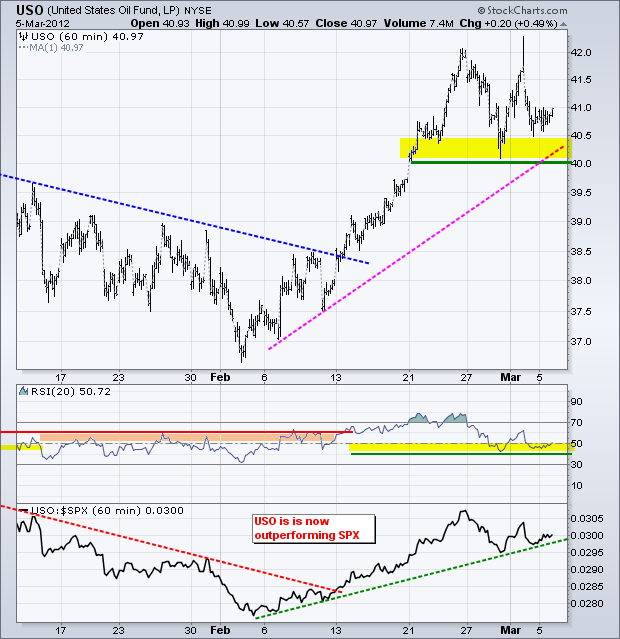
No change. If stocks start a correction and the Dollar bounces, then the US Oil Fund (USO) could come under pressure and follow stocks lower. USO surged above 40 and then moved into a choppy range fueled by rumors of a Saudi pipeline explosion. With the late February bounce, key support is set in the 40-40.50 area. A break below this level would argue for a short-term downtrend with an initial target in the 38.5-39 area. RSI is in its support zone and a break below 40 would be bearish for momentum.
**************************************************************************
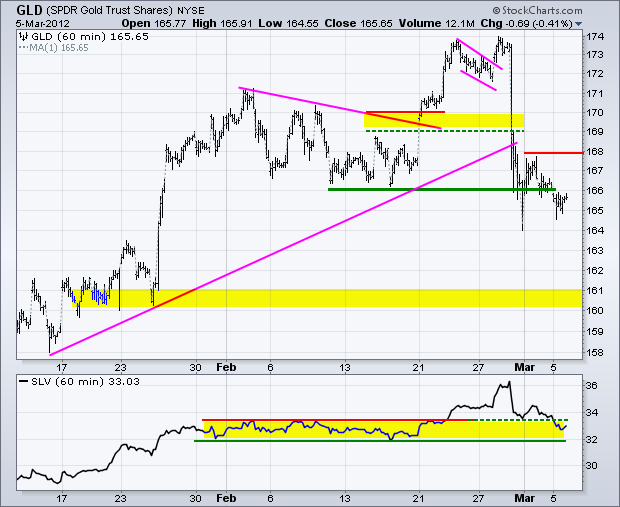
The Gold SPDR (GLD) is consolidating around support from the mid February lows. For now, the ETF broke down with the sharp decline last week and has yet to recover. Even though support is holding, a move back above 168 is needed to suggest a recovery and resumption of the January-February advance.
**************************************************************************
Key Economic Reports:
Wed - Mar 07 - 07:00 - MBA Mortgage Index
Wed - Mar 07 - 08:15 - ADP Employment Change
Wed - Mar 07 - 10:30 - Oil Inventories
Wed - Mar 07 - 15:00 - Consumer Credit
Thu - Mar 08 - 07:30 – Deadline for Greek Debt Holders
Thu - Mar 08 - 07:30 - Challenger Job Cuts
Thu - Mar 08 - 08:30 - Jobless Claims
Fri - Mar 09 - 08:30 - Employment Report
Charts of Interest: Tuesday and Thursday in separate post.
This commentary and charts-of-interest are designed to stimulate thinking. This analysis is not a recommendation to buy, sell, hold or sell short any security (stock ETF or otherwise). We all need to think for ourselves when it comes to trading our own accounts. First, it is the only way to really learn. Second, we are the only ones responsible for our decisions. Think of these charts as food for further analysis. Before making a trade, it is important to have a plan. Plan the trade and trade the plan. Among other things, this includes setting a trigger level, a target area and a stop-loss level. It is also important to plan for three possible price movements: advance, decline or sideways. Have a plan for all three scenarios BEFORE making the trade. Consider possible holding times. And finally, look at overall market conditions and sector/industry performance.

