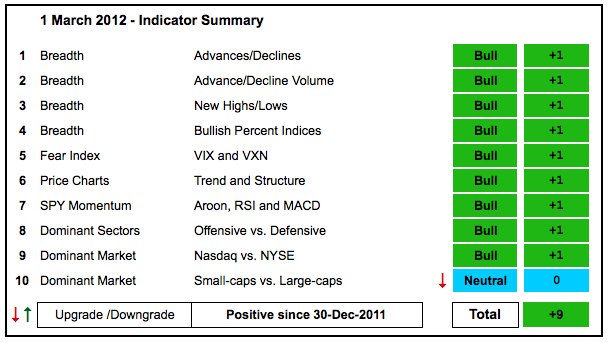
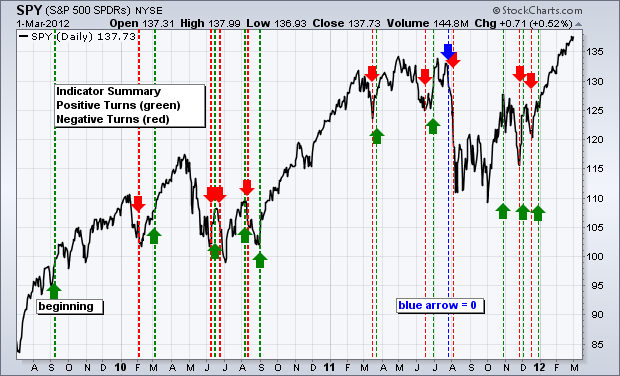
The bulk of the evidence remains bullish, but there was one downgrade on the indicator summary. Small-caps have seriously underperformed large-caps in February and the Price Relative ($RUT:$OEX) ratio moved sharply lower. Even though I am not quite ready to turn bearish on this indicator, it did merit a downgrade from bullish to neutral. Stocks remain in uptrends with slowing momentum. Buying pressure is still outpacing selling pressure, just at lower levels. Most importantly, we have yet to see a significant uptick in selling pressure that would signal the start of a correction. Note that the AD Lines and AD Volume Lines are now based on ratios (Net Advances divided by Total Issues and Net Advancing Volume divided by Total Volume). These ratios provide a more balanced picture of the volume flows.
- AD Lines: Bullish. The Nasdaq AD Line broke out in early January and is now stalling near the October high. The NYSE AD Line forged another new 52-week high this week and remains in a strong uptrend.
- AD Volume Lines: Bullish. The Nasdaq and NYSE AD Volume Lines broke above their 2011 highs and remain in clear uptrends.
- Net New Highs: Bullish. Nasdaq Net New Highs have been positive since early January and the Cumulative Net New Highs Line moved above its 10-day EMA the second week of January. NYSE Net New Highs have been largely positive since late November and the Cumulative Net New Highs Line is in a strong uptrend.
- Bullish Percent Indices: Bullish. Eight of the nine sector Bullish Percent Indices are above 80%. The Energy Bullish% Index ($BPENER) is at 76.74%, which is hardly weak.
- VIX/VXN: Bullish. After bouncing the first half of February, the CBOE Volatility Index ($VIX) and the Nasdaq 100 Volatility Index ($VXN) fell back and remain in clear downtrends.
- Trend-Structure: Bullish. DIA, SPY and QQQ recorded new 52-week highs this week, but IWM and MDY are starting to lag. IWM peaked on 3-Feb and MDY peaked on 17-Feb.
- SPY Momentum: Bullish. RSI is in its bull range (40-80), the Aroon Oscillator surged back above +50 on 27-Dec and MACD(5,35,5) has been positive since 21-Dec.
- Offensive Sector Performance: Bullish. The Technology SPDR (XLK) and Consumer Discretionary SPDR (XLY) continue to move higher, but the Finance SPDR (XLF) and the Industrials SPDR (XLI) have stalled somewhat. Nevertheless, we have yet to see breakdowns and absolute weakness.
- Nasdaq Performance: Bullish. The $COMPQ:$NYA ratio broke above its mid December high and techs have been outperforming in 2012.
- Small-cap Performance: Neutral. The $RUT:$OEX ratio moved sharply lower this month as small-caps underperformed large-caps.
- Breadth Charts (here) and Inter-market charts (here) have been updated.
This table is designed to offer an objective look at current market conditions. It does not aim to pick tops or bottoms. Instead, it seeks to identify noticeable shifts in buying and selling pressure. With 10 indicator groups, the medium-term evidence is unlikely to change drastically overnight.
Previous turns include:
Positive on 30-December-11
Negative on 16-December-11
Positive on 3-December-11
Negative on 23-November-11
Positive on 28-October-11
Negative on 5-August-11
Neutral on 29-Jul-11
Positive on 30-Jun-11
Negative on 17-Jun-11
Positive on 25-Mar-11
Negative on 18-Mar-11
Positive on 3-Sep-10
Negative on 13-Aug-10
Positive on 6-Aug-10
Negative on 24-Jun-10
Positive on 18-Jun-10
Negative on 11-Jun-10
Positive on 5-March-10
Negative on 5-Feb-10
Positive on 11-Sept-09


