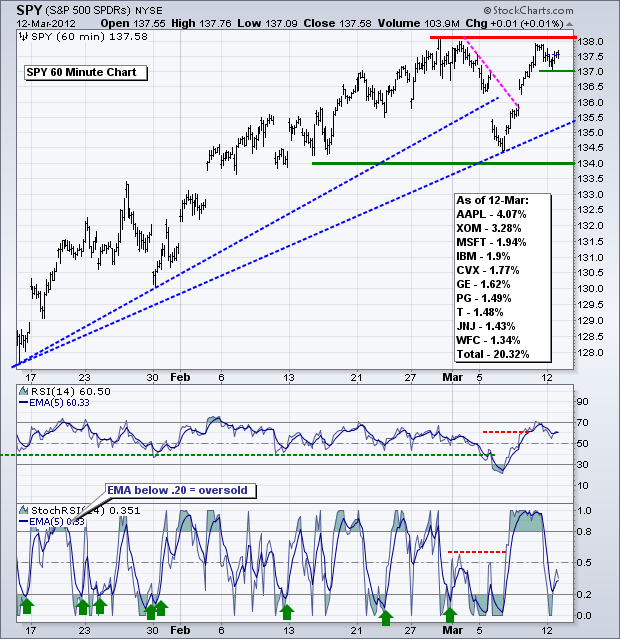
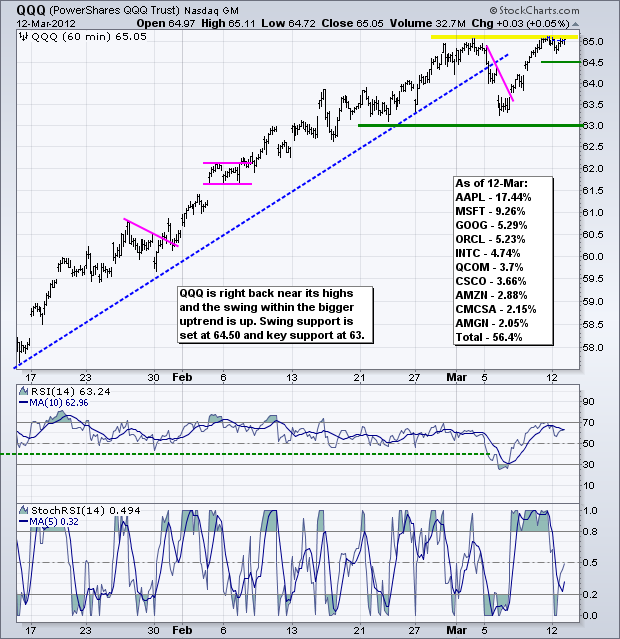
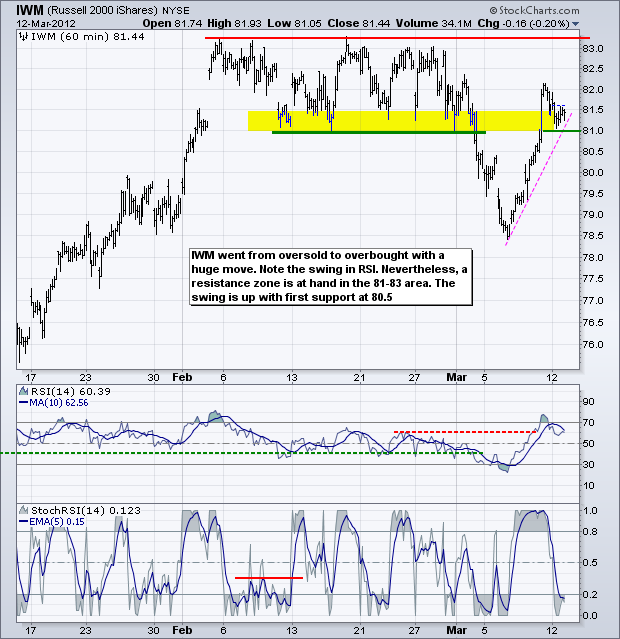
Stocks were mixed on Monday with the Dow edging higher and the Russell 2000 edging lower. Sector action was also mixed with technology gaining a fraction and the consumer discretionary sector finishing slightly lower. In an interesting twist, the consumer staples and utilities sectors were the biggest gainers. In fact, the Utilities SPDR (XLU) surged over 1% and broke consolidation resistance. Perhaps money is getting a little defensive with the broader market overextended and ripe for a corrective period. Otherwise, there is not much change on the charts. SPY stalled just below its prior highs, QQQ stalled at its prior highs and IWM failed to reach its prior highs. As noted before, it is possible that an extended trading range could be taking shape and this range could extend for a few weeks. The early March low marks first support for SPY and the late February high marks resistance. While a breakout would be positive, be careful for a bull trap (failed breakout). Retail Sales is Tuesday, the Fed makes its policy statement Tuesday afternoon, the Philly Fed releases its survey on Thursday and Industrial Production closes out the week on Friday.
**************************************************************************
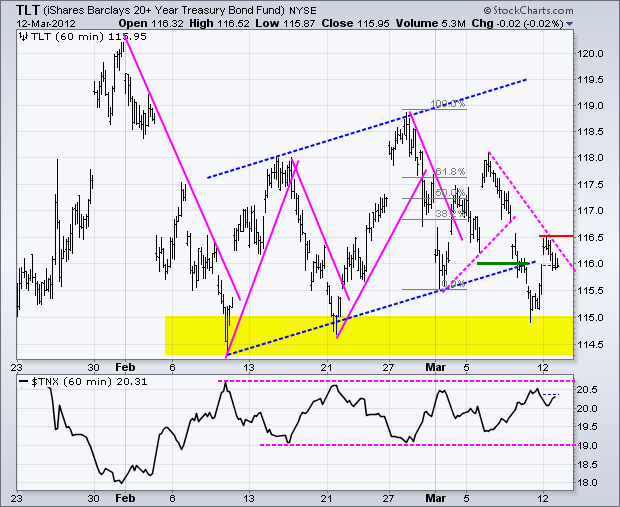
The treasury market could get pushed and pulled all over the place this week. Retails Sales will give us more clues on the strength of the economy. Judging from the recent 52-week high in the Retail SPDR (XRT), this report could be fairly robust, which would be negative for treasuries. The Fed makes its policy statement on Wednesday and failure to mention QE3 would also be negative. On the price chart, the 20+ Year T-Bond ETF (TLT) broke rising channel support with a sharp decline last week. There was a rebound on Friday, but the support break remains for the most part. I am setting first resistance at 116.50. Also watch the 10-year Treasury Yield ($TNX) for a possible upside breakout, which could be bearish for treasuries.
**************************************************************************
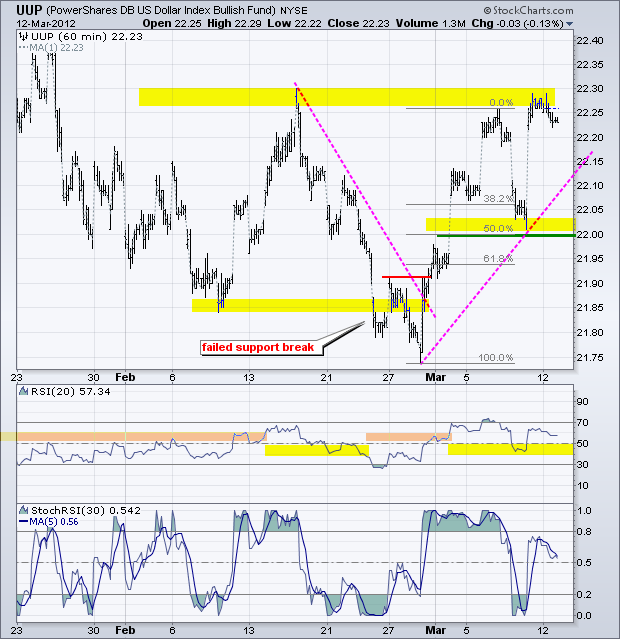
No change. On the price chart, the US Dollar Fund (UUP) reversed near the 50% retracement line and surged back to resistance. With this move, I am now marking key support at 22 and will expect higher prices as long as this level holds. RSI held support in the 40-50 zone and momentum remains bullish.
**************************************************************************
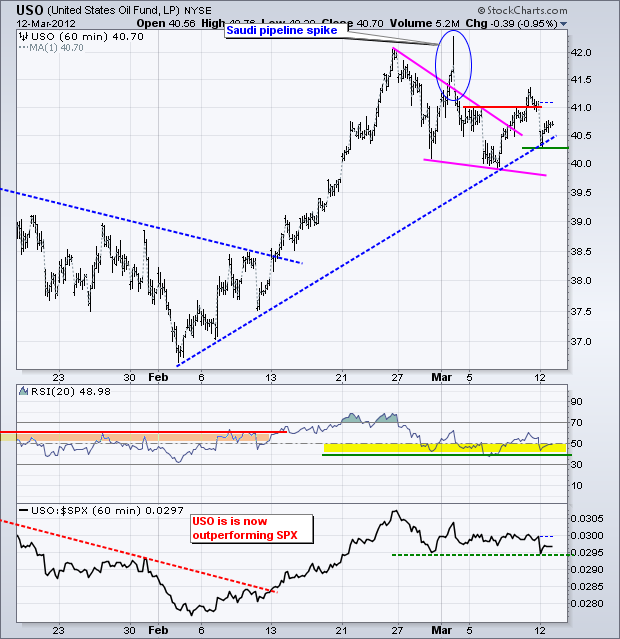
The US Oil Fund (USO) fell back below its resistance breakout at 41, but the ETF managed to firm at the trendline extending up from early February. There is a support zone in the 40.3-40.5 area that I am watching closely. Failure to hold this zone would be negative. A lot could depend on the stock market, retail sales and the Fed meeting. Strength in stocks and a strong retail sales report would be bullish for energy demand. However, failure to mention QE3 could weigh on commodity prices.
**************************************************************************
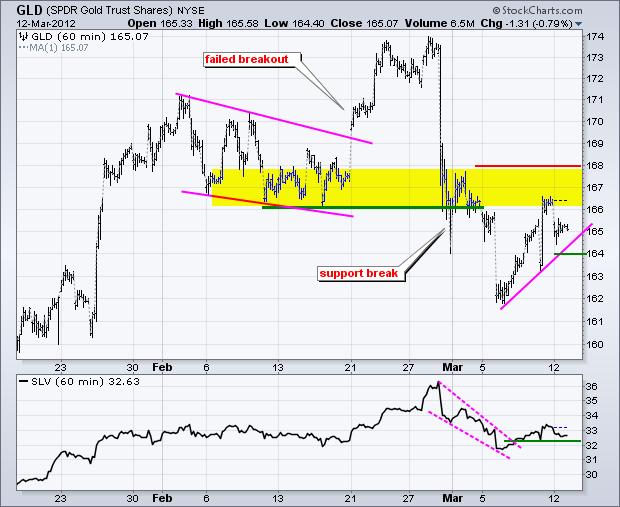
The Gold SPDR (GLD) is waiting on the Fed statement with baited breath. Gold got knocked hard when Bernanke failed to mention QE3 during his recent testimony before congress. Another failure could further rattle the gold market. On the price chart, GLD bounced back to broken support, which now turns into resistance. A rising flag type pattern is taking shape with support at 164. A break below this level would signal a continuation lower and project further weakness towards the 160 area. Key resistance remains at 168.
**************************************************************************
Key Economic Reports:
Tue - Mar 13 - 08:30 - Retail Sales
Tue - Mar 13 - 10:00 - Business Inventories
Tue - Mar 13 - 14:15 - FOMC Policy Statement
Wed - Mar 14 - 07:00 - MBA Mortgage Index
Wed - Mar 14 - 10:30 - Oil Inventories
Thu - Mar 15 - 08:30 - Jobless Claims
Thu - Mar 15 - 08:30 - Empire State Manufacturing Survey
Thu - Mar 15 - 08:30 - Producer Price Index (PPI)
Thu - Mar 15 - 10:00 - Philadelphia Fed Survey
Fri - Mar 16 - 08:30 - Consumer Price Index (CPI)
Fri - Mar 16 - 09:15 - Industrial Production
Fri - Mar 16 - 09:55 - Michigan Sentiment
Charts of Interest: Tuesday and Thursday in separate post.
This commentary and charts-of-interest are designed to stimulate thinking. This analysis is not a recommendation to buy, sell, hold or sell short any security (stock ETF or otherwise). We all need to think for ourselves when it comes to trading our own accounts. First, it is the only way to really learn. Second, we are the only ones responsible for our decisions. Think of these charts as food for further analysis. Before making a trade, it is important to have a plan. Plan the trade and trade the plan. Among other things, this includes setting a trigger level, a target area and a stop-loss level. It is also important to plan for three possible price movements: advance, decline or sideways. Have a plan for all three scenarios BEFORE making the trade. Consider possible holding times. And finally, look at overall market conditions and sector/industry performance.


