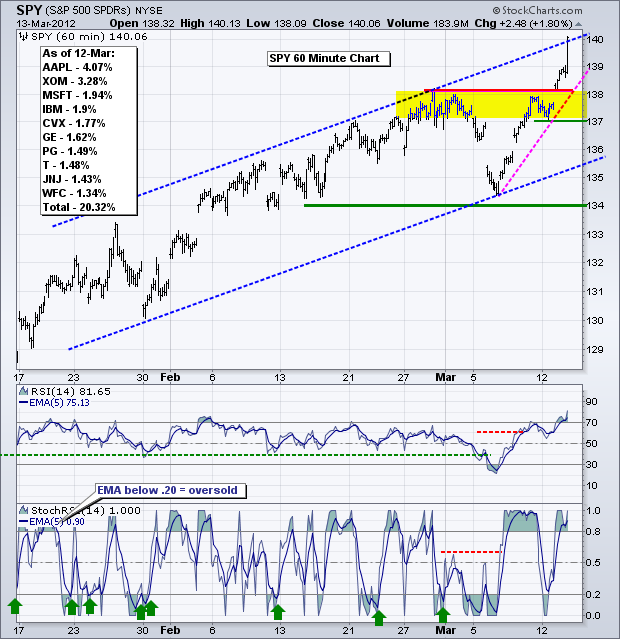
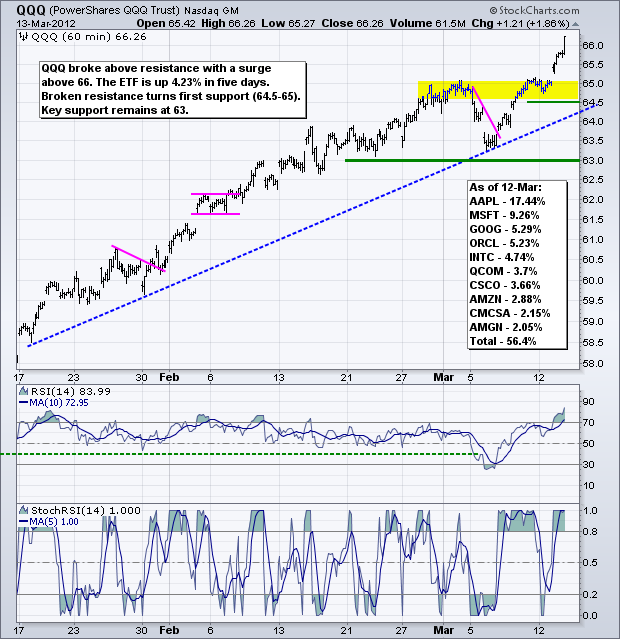
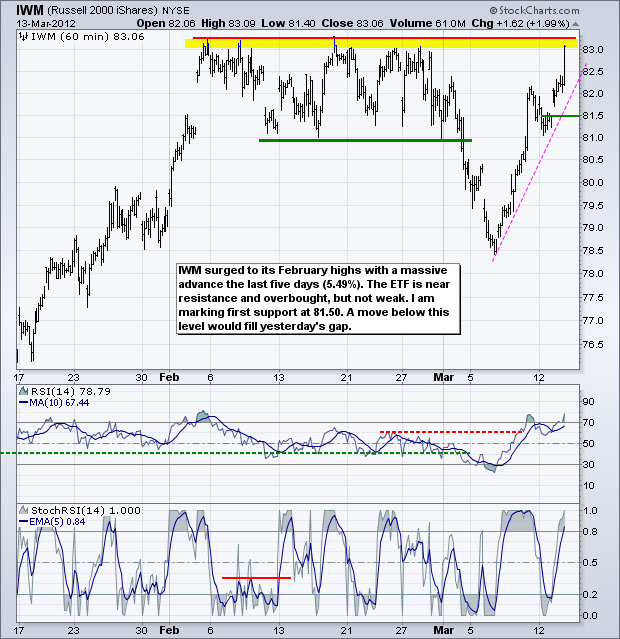
Stocks caught a big bullish wind in the final hour and surged with financials leading the charge. Yesterday's surge certainly has the markings of a blow-off top, which is the opposite of a selling climax. However, picking a top in this environment is very dangerous. On the 60-minute chart, SPY surged above the upper trendline of a rising channel with a close above 140. While this move above the channel suggests that the ETF is overextended, it is by no means weak. There is a resistance zone in the 137-138 area that now turns into the first support zone to watch on any throwback. To further the overbought case, note that 14-period RSI on the 60-minute chart moved above 80 for the fourth time in 18 months. The other dates were 4-Nov-11, 29-Apr-11 and 1-Jul-11. Prior readings above 80 coincided with peaks in SPY and the ETF subsequently declined at least five points.
**************************************************************************
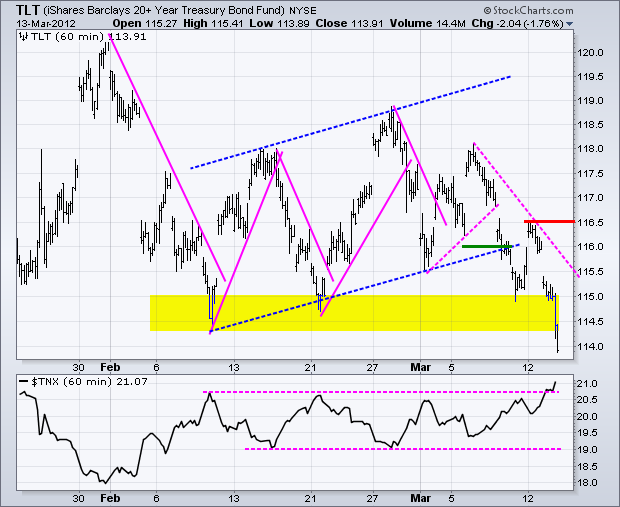
Treasuries got hit with a double whammy on Tuesday. Retail Sales grew at 1.1% for February, which was the highest rate in five months. The Fed policy statement noted that the economy was improving. Nevertheless, Bernanke left the door open to further easing by noting the significant risk remain. Sounds like he is "cautiously bullish". Treasuries fell sharply with the 20+ Year T-Bond ETF (TLT) breaking below its February lows. The 10-year Treasury Yield ($TNX) broke above its February highs and exceeded 2.1% for the first time since early December.
**************************************************************************
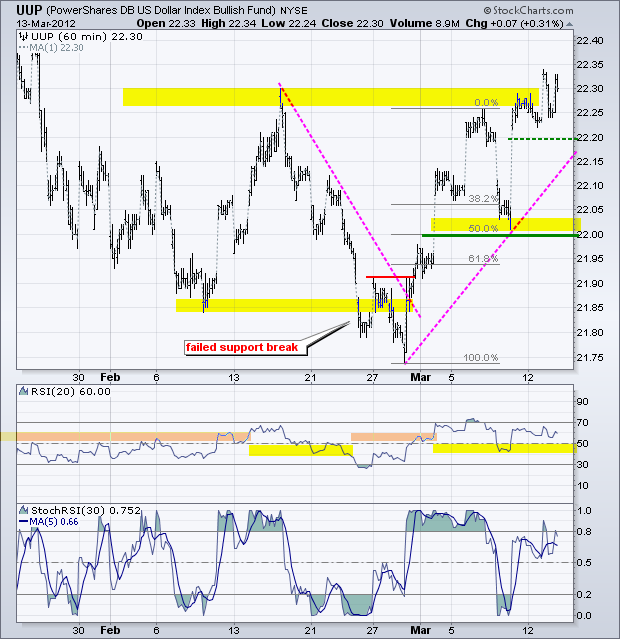
Rising interest rates and an improving economy lifted the Dollar. The US Dollar Fund (UUP) broke above its February high, just as Treasuries broke below their February low. There are some changing dynamics afoot. The Dollar is going up even when treasuries decline and the stock market is rising when the Dollar advances. Key support for UUP remains at 22 and RSI support at 40.
**************************************************************************
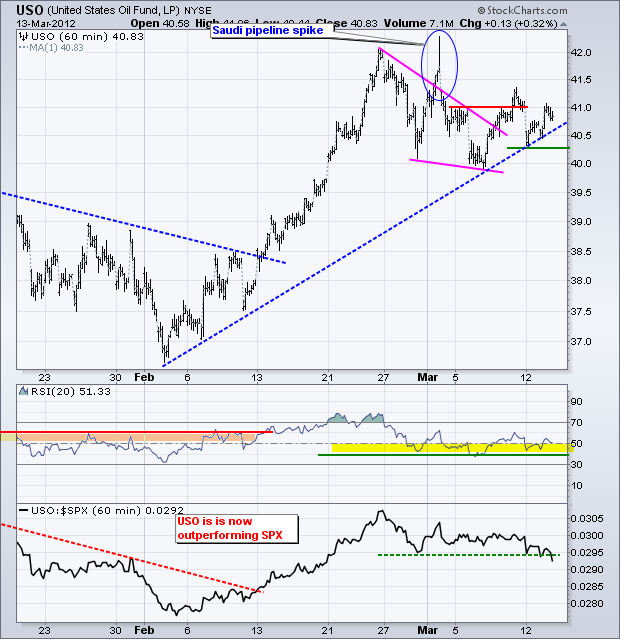
I am a bit concerned with the performance of oil. Even though the US Oil Fund (USO) edged higher, it remains well below its February high and is starting to underperform the stock market. It appears that the strong Dollar and absence of QE3 talk is weighing on commodity prices. USO is barely holding the wedge breakout and I am marking support at 40.30. A break below this level and an RSI move below 40 would be bearish.
**************************************************************************
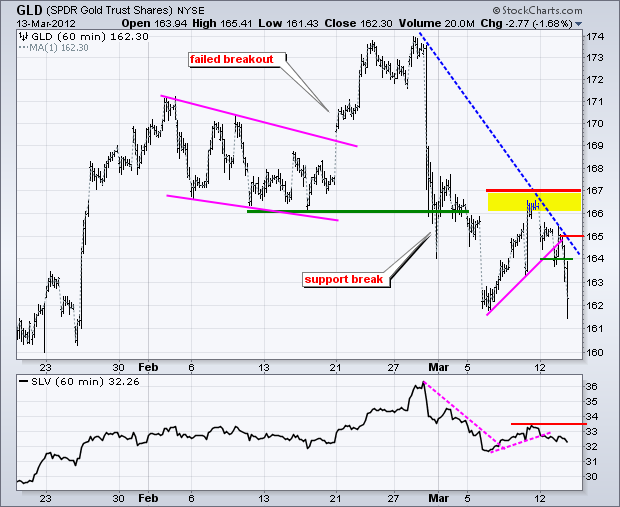
A strong Dollar and less accommodative Fed pushed gold prices lower. The Gold SPDR (GLD) broke support at 164 and closed below 163. Broken support and the late February trendline mark first resistance around 164-165. Key resistance is set at 167.
**************************************************************************
Key Economic Reports:
Wed - Mar 14 - 07:00 - MBA Mortgage Index
Wed - Mar 14 - 10:30 - Oil Inventories
Thu - Mar 15 - 08:30 - Jobless Claims
Thu - Mar 15 - 08:30 - Empire State Manufacturing Survey
Thu - Mar 15 - 08:30 - Producer Price Index (PPI)
Thu - Mar 15 - 10:00 - Philadelphia Fed Survey
Fri - Mar 16 - 08:30 - Consumer Price Index (CPI)
Fri - Mar 16 - 09:15 - Industrial Production
Fri - Mar 16 - 09:55 - Michigan Sentiment
Charts of Interest: Tuesday and Thursday in separate post.
This commentary and charts-of-interest are designed to stimulate thinking. This analysis is not a recommendation to buy, sell, hold or sell short any security (stock ETF or otherwise). We all need to think for ourselves when it comes to trading our own accounts. First, it is the only way to really learn. Second, we are the only ones responsible for our decisions. Think of these charts as food for further analysis. Before making a trade, it is important to have a plan. Plan the trade and trade the plan. Among other things, this includes setting a trigger level, a target area and a stop-loss level. It is also important to plan for three possible price movements: advance, decline or sideways. Have a plan for all three scenarios BEFORE making the trade. Consider possible holding times. And finally, look at overall market conditions and sector/industry performance.

