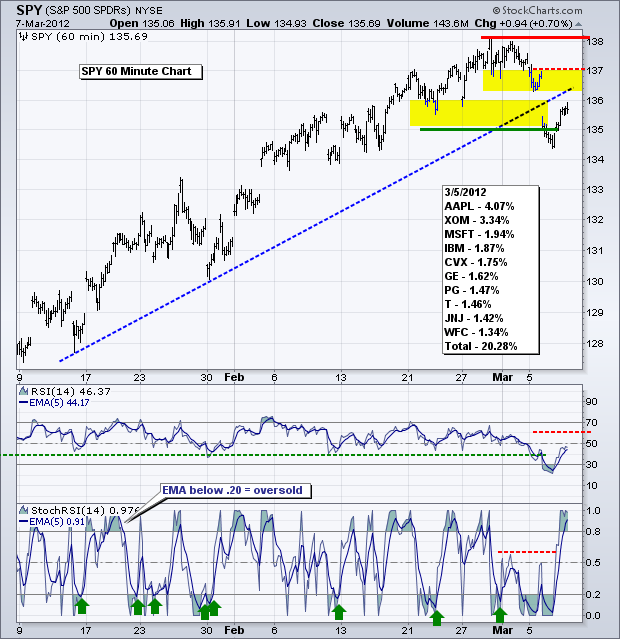
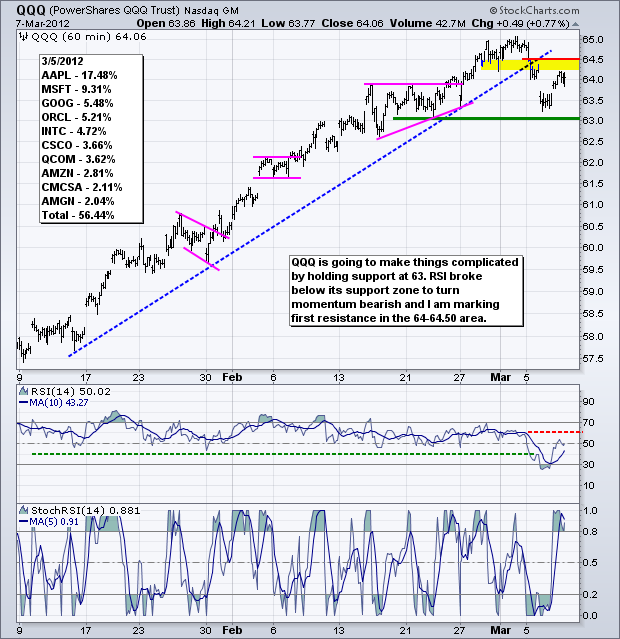
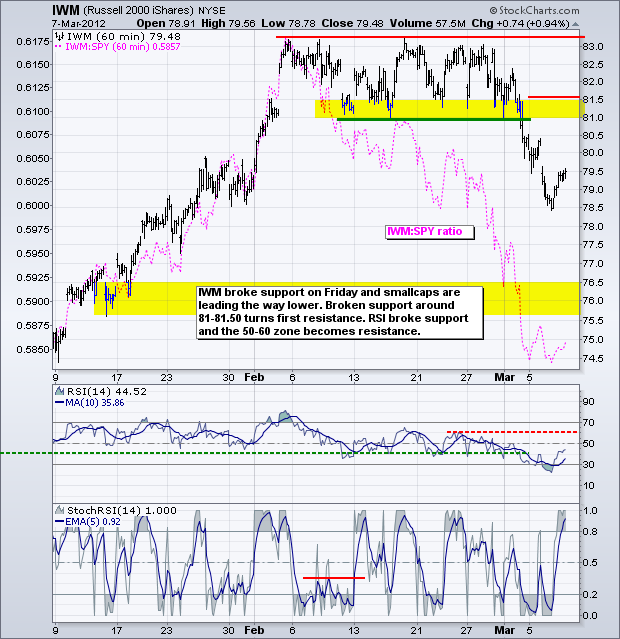
After sharp declines that created oversold conditions on Tuesday, stocks firmed and bounced on Wednesday. The S&P 500 ETF (SPY) broke support at 135 on Tuesday, but moved back above this level on Wednesday. Even though the short-term trend is considered down, the bigger trend is up and could pull trump at anytime. Sidelined money is likely tempted to enter the market after the sharpest decline in 11-12 weeks. Moreover, the employment report is due Friday morning and a better-than-expected number could further lift stocks. On the SPY chart, broken support and the trendline extension turn into first resistance in the 136.4-137 area. RSI resistance is set in the 50-60 zone.
**************************************************************************
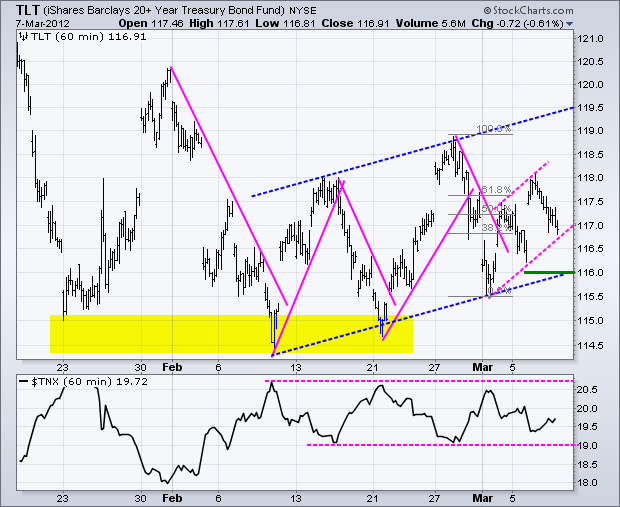
Friday's employment report could mark make-or-break time for treasuries. The trend is current up, but treasuries are having a hard time holding gains. On the 20+ Year T-Bond ETF (TLT) chart, the March bounce retraced just over 61.80% of the prior decline and formed an unorthodox rising flag. The retracement is typical for a bear bounce and the rising flag is a bearish pattern. A better-than-expected employment report would weigh on treasuries and we could then see a support break at 116. Such a move would be positive for stocks.
**************************************************************************
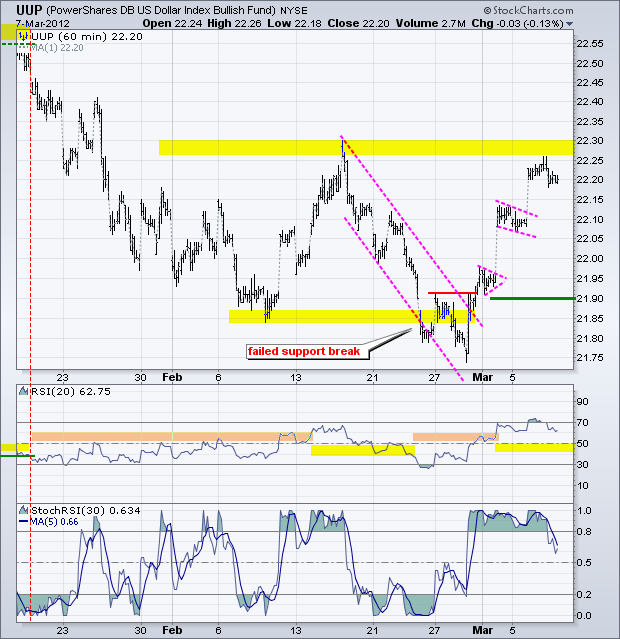
No change. The US Dollar Fund (UUP) surged and consolidated again. This time resistance from the mid February highs is coming into play. Also note that the Dollar is short-term overbought after a surge the last 5 days. RSI moved into bull mode with a break above 60 and the 40-50 zone becomes support. Greek bondholders are in the process of accepting or rejecting the terms of their haircut. The deadline is Thursday and successful resolution could provide a boost for the oversold Euro.
**************************************************************************
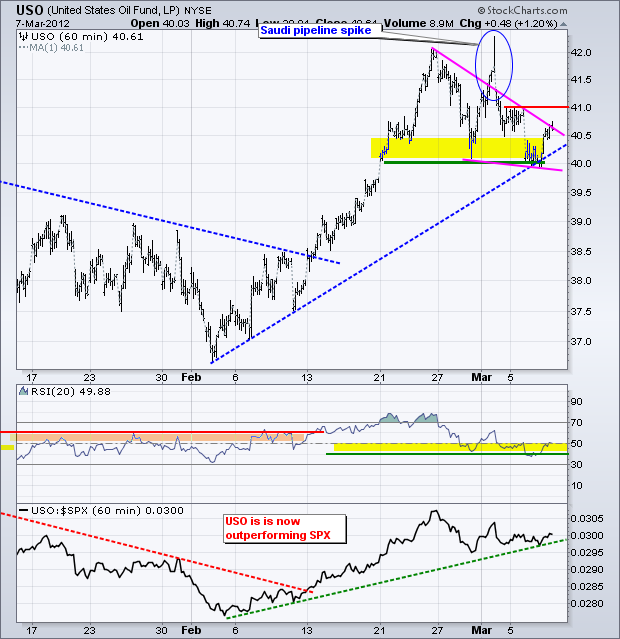
Oil declined along with the stock market on Tuesday and bounced with the stock market on Wednesday. Overall, I am drawing through the spike above 42 because this was based on false rumors of a Saudi pipeline explosion. The pattern looks like a falling wedge with resistance at 41. A break above this level would signal a continuation higher. RSI is firming in its support zone and momentum still favors the bulls.
**************************************************************************
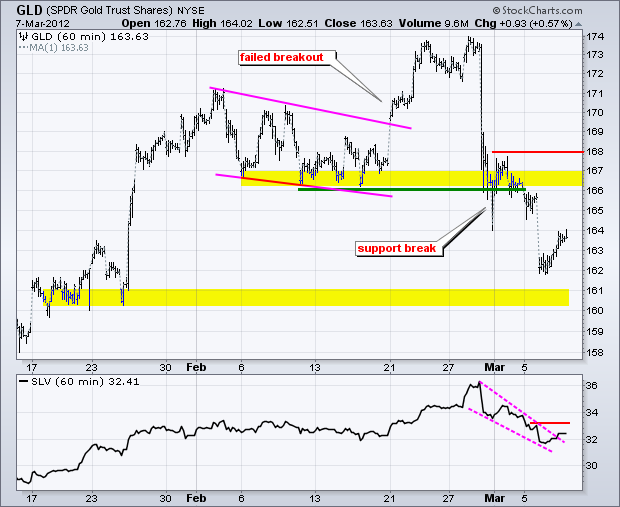
The Gold SPDR (GLD) rebounded along with the stock market and oil. Some sort of bounce can be expected because the ETF became short-term oversold after the decline from 174 to 162. GLD Broken support in the 166-167 area turns into the first resistance zone to watch. I am setting key resistance at 168 for now.
**************************************************************************
Key Economic Reports:
Thu - Mar 08 - 07:30 – Deadline for Greek Debt Holders
Thu - Mar 08 - 07:30 - Challenger Job Cuts
Thu - Mar 08 - 08:30 - Jobless Claims
Fri - Mar 09 - 08:30 - Employment Report
Charts of Interest: Tuesday and Thursday in separate post.
This commentary and charts-of-interest are designed to stimulate thinking. This analysis is not a recommendation to buy, sell, hold or sell short any security (stock ETF or otherwise). We all need to think for ourselves when it comes to trading our own accounts. First, it is the only way to really learn. Second, we are the only ones responsible for our decisions. Think of these charts as food for further analysis. Before making a trade, it is important to have a plan. Plan the trade and trade the plan. Among other things, this includes setting a trigger level, a target area and a stop-loss level. It is also important to plan for three possible price movements: advance, decline or sideways. Have a plan for all three scenarios BEFORE making the trade. Consider possible holding times. And finally, look at overall market conditions and sector/industry performance.

