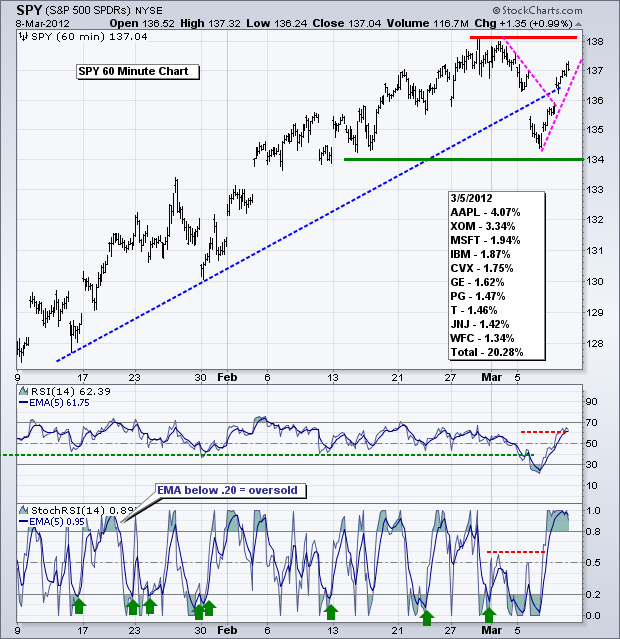
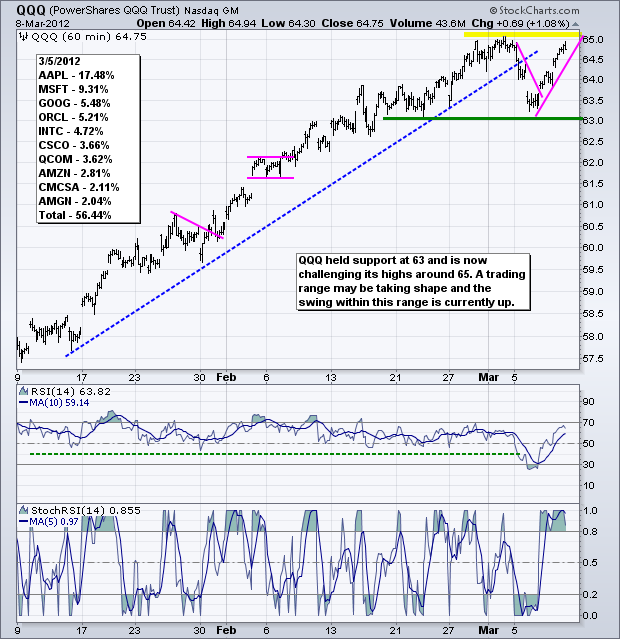
There is nothing like the first decent dip after a strong advance. Stocks advanced for some 11 weeks and then corrected hard with a sharp decline Friday-Monday-Tuesday. The S&P 500 ETF (SPY) was down around 2% over these three days. Those who missed the rally or were under invested seized on this mini-bargain to gobble up stocks the last two days. While the sharp pullback and sharp bounce are not surprising, playing them effectively is another issue and only for the most nimble of traders. It is possible that a choppy corrective period is starting, which means we could see SPY swing from resistance zone to support zone for a few weeks. There is clearly support in the 134 area and resistance in the 138 area. The swing is up with the steep pink trendline marking first support.
**************************************************************************
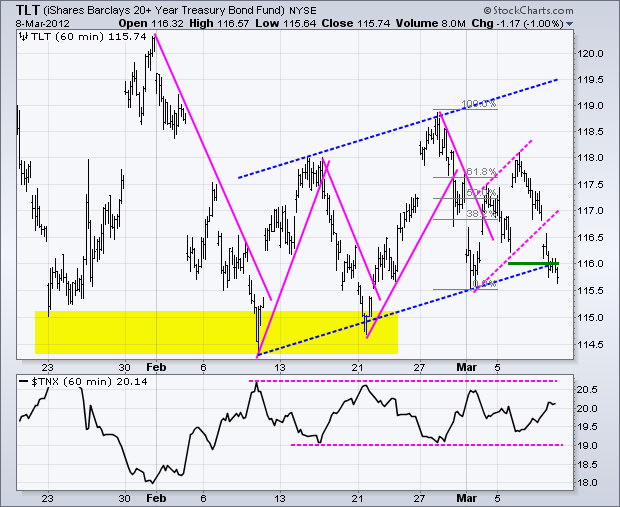
Treasuries could not stand the heat and the 20+ Year T-Bond ETF (TLT) broke down ahead of the employment report. Can't say I blame them. The employment trend is up and the Fed may be backing off QE3, which bodes well for the economic outlook. TLT broke flag support and moved below 116 by the close. Money moving out of treasuries found its way into the stock market. This breakdown in TLT looks like a continuation of the early February decline. Even though I am expected a trading range in stocks, further weakness in treasuries would be positive for stocks.
**************************************************************************
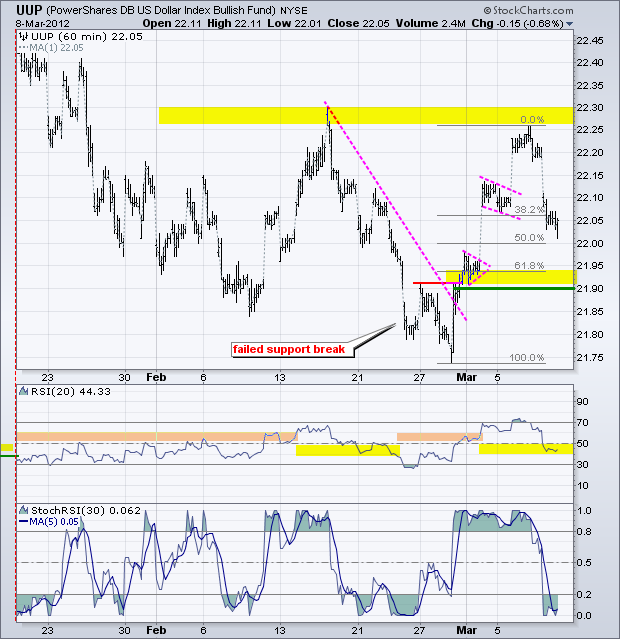
Success on the Greek debt front and weakness in treasuries weighed on the Dollar. The US Dollar Fund (UUP) surged to resistance with a big move and then fell back sharply on Thursday. The pullback has thus far retraced around 50% of the prior surge and RSI moved into the 50-60 zone. A strong employment report would signal a less accommodative stance from the Fed and this may in fact be bullish for the Dollar. Quantitative easing dilutes the Dollar and any hints against QE3 would be positive for the greenback.
**************************************************************************
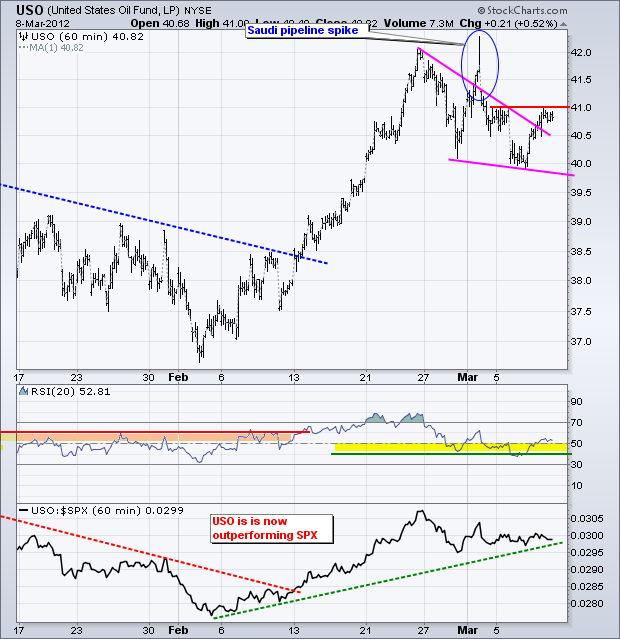
Oil is at its moment-of-truth and likely dependant on the stock market. After a big surge in February, the US Oil Fund (USO) corrected with a falling wedge and RSI moved back to the 40-50 zone. The ETF broke the wedge trendline and is now challenging resistance. Strength in stocks would likely trigger a breakout at 41 and signal a continuation of the bigger uptrend.
**************************************************************************
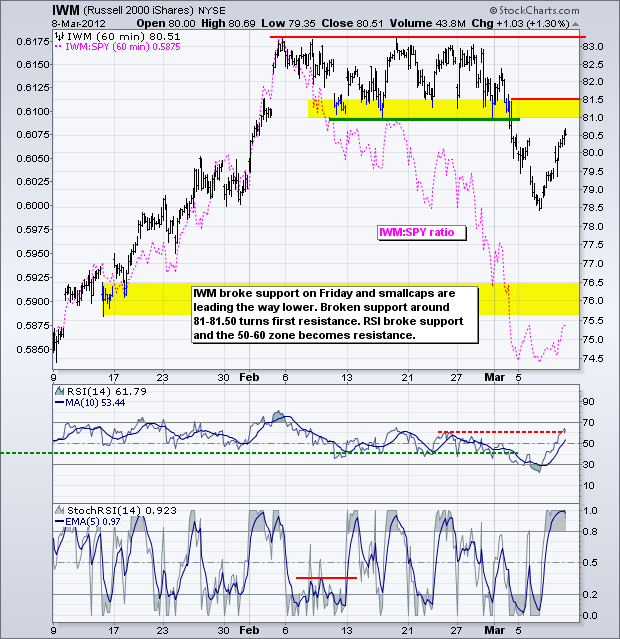
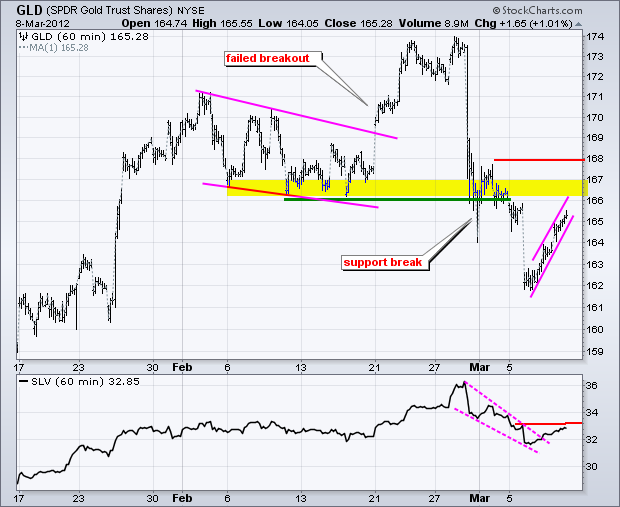
A rebound in stocks and weakness in the Dollar pushed gold higher the last two days. Like the Russell 2000 ETF (IWM), the Gold SPDR (GLD) broke a clear support zone and this zone turns into first resistance. Perhaps the support break was an overshoot, perhaps not. The first step to rectifying this support break is to move back above it. Key resistance remains at 168. A better-than-expected employment report would provide more evidence against QE3 and this could also weigh on gold.
**************************************************************************
Key Economic Reports:
Fri - Mar 09 - 08:30 - Employment Report
Charts of Interest: Tuesday and Thursday in separate post.
This commentary and charts-of-interest are designed to stimulate thinking. This analysis is not a recommendation to buy, sell, hold or sell short any security (stock ETF or otherwise). We all need to think for ourselves when it comes to trading our own accounts. First, it is the only way to really learn. Second, we are the only ones responsible for our decisions. Think of these charts as food for further analysis. Before making a trade, it is important to have a plan. Plan the trade and trade the plan. Among other things, this includes setting a trigger level, a target area and a stop-loss level. It is also important to plan for three possible price movements: advance, decline or sideways. Have a plan for all three scenarios BEFORE making the trade. Consider possible holding times. And finally, look at overall market conditions and sector/industry performance.


