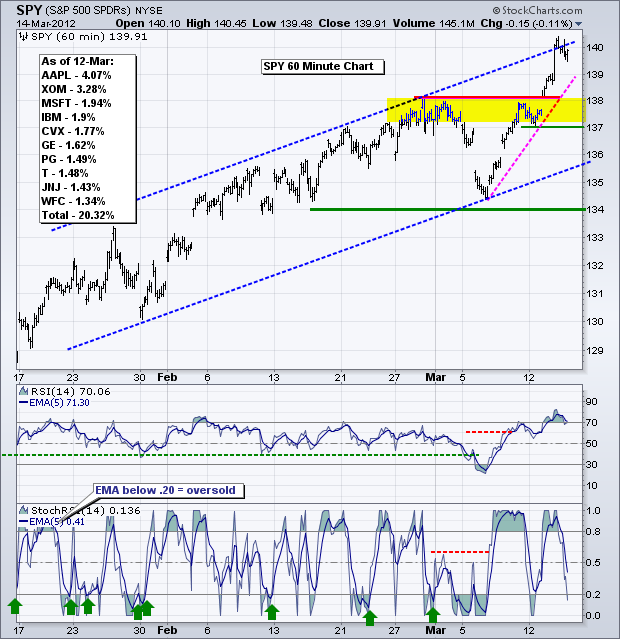
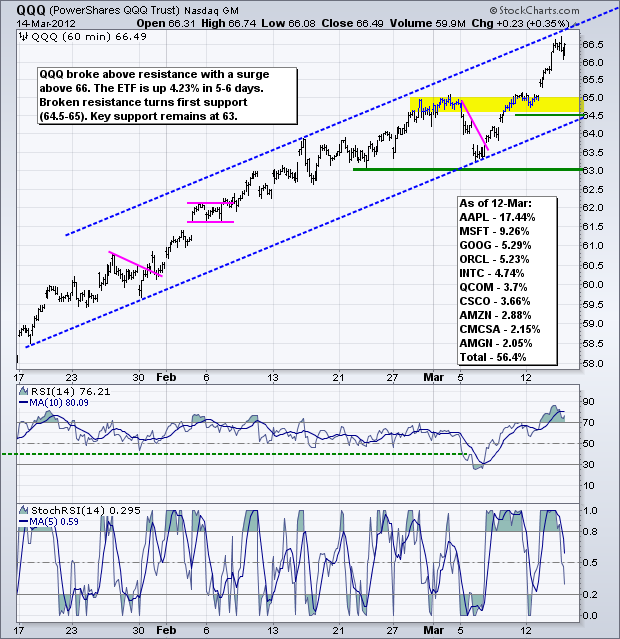
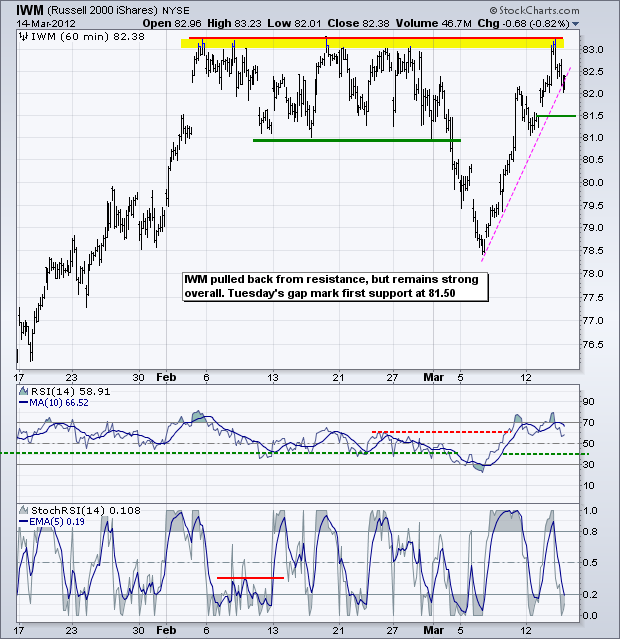
Treasuries are falling off a cliff, commodities are softening, gold is plunging, the Dollar is strengthening and stocks remain the best game in town. The recent decline in treasuries suggests that the economy will continue to expand and the labor market will continue to improve. Money moving out of treasuries has to go somewhere and that somewhere could be the stock market, even though stocks are still overextended. Perhaps the terms overextended and overbought are, well, overused. Stocks may be overextended, but there are simply NO signs of significant selling pressure. The S&P 500 ETF (SPY) moved to the upper trendline of a rising channel and stalled around 140 on Wednesday. Broken resistance in the 137-138 area marks the first support zone to watch on any throw back. Key support remains at 134 for now.
**************************************************************************
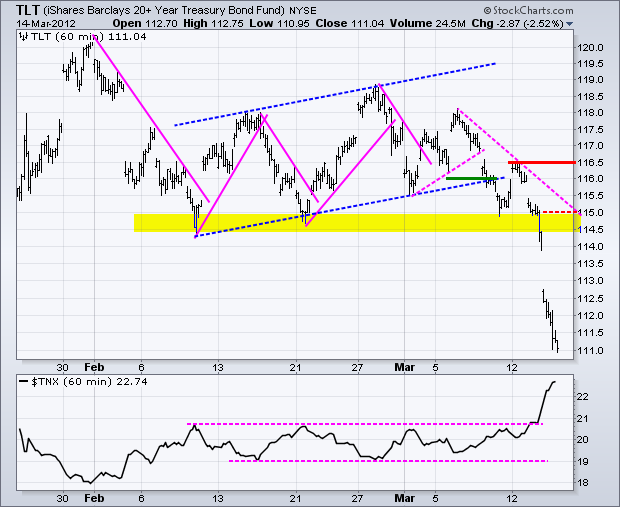
The mass exodus from treasuries continues. The 20+ Year T-Bond ETF (TLT) broke support at 116 late last week and fell around 5% the last three days. Even though the ETF is already short-term oversold, this is a big breakdown on the daily chart and TLT could become even more oversold. Only a shock to the economy or job growth will stem this slide. Broken support in the 114.5-115 area turns into the first resistance zone to watch.
**************************************************************************
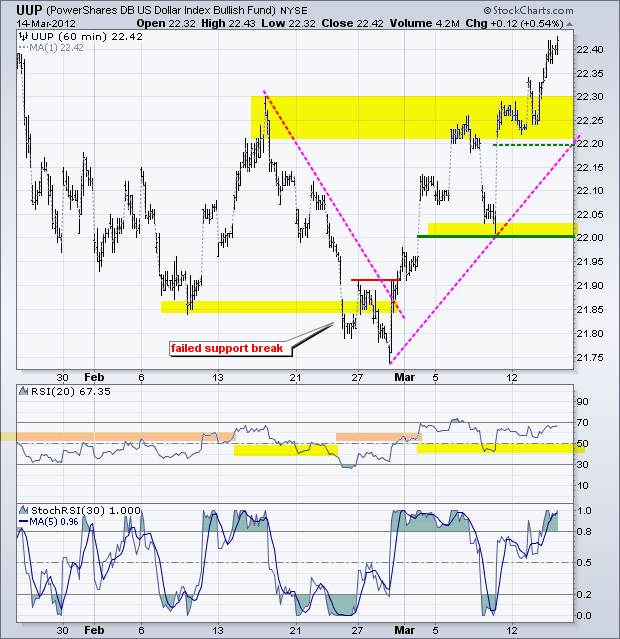
Rising interest rates and the prospects of a less accommodative Fed propelled the Dollar above resistance from the February high. In just two weeks, the US Dollar Fund (UUP) went from a failed support break to a resistance break. Talk about strong. Broken resistance and this week's low mark first support in the 22.20 area.
**************************************************************************
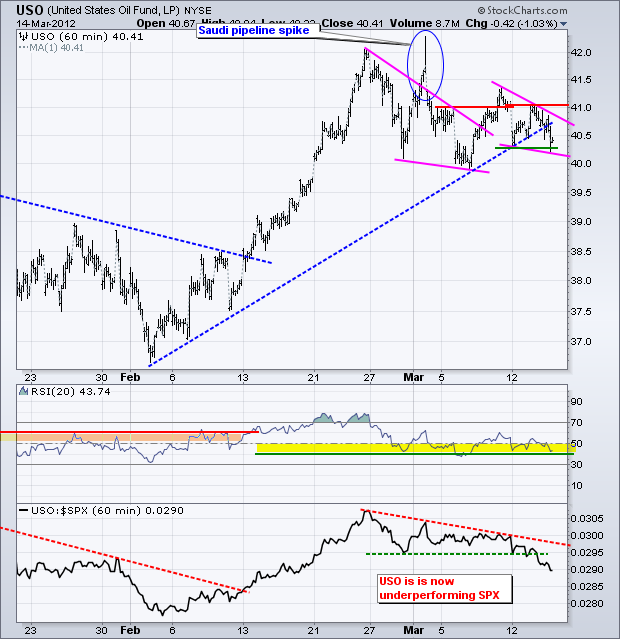
I remain concerned with the performance of oil. First, the breakout at 41 failed to hold and the ETF fell back below 40.50 on Wednesday. Second, strength in the Dollar and the absence of QE3 talk are weighing on commodities in general. While a strong stock market, an improving economy and a better employment picture are positive for oil prices, this has yet to affect prices. A second, and smaller, falling wedge is taking shape with resistance again at 41.
**************************************************************************
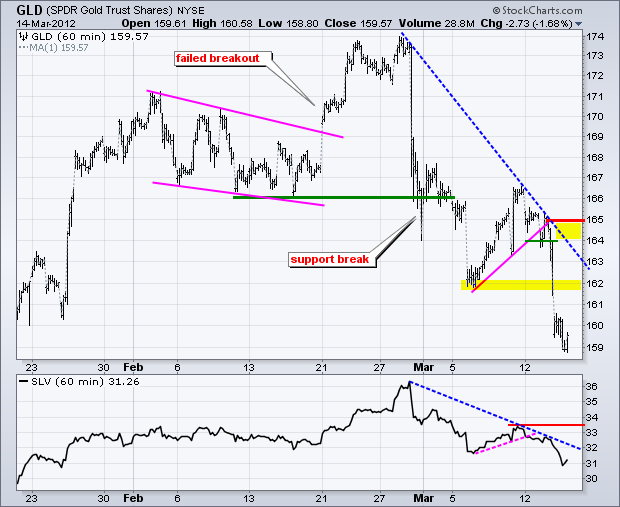
Money is moving out of gold as fast as it is moving out of treasuries. Strength in the Dollar and the absence of QE3 talk are to blame. The Gold SPDR (GLD) broke support in early March, rebounded back to broken support and then fell again with a move to the 160 area. Broken support in the 162 area turns first resistance. Key resistance is set at 165 for now.
**************************************************************************
Key Economic Reports:
Thu - Mar 15 - 08:30 - Jobless Claims
Thu - Mar 15 - 08:30 - Empire State Manufacturing Survey
Thu - Mar 15 - 08:30 - Producer Price Index (PPI)
Thu - Mar 15 - 10:00 - Philadelphia Fed Survey
Fri - Mar 16 - 08:30 - Consumer Price Index (CPI)
Fri - Mar 16 - 09:15 - Industrial Production
Fri - Mar 16 - 09:55 - Michigan Sentiment
Charts of Interest: Tuesday and Thursday in separate post.
This commentary and charts-of-interest are designed to stimulate thinking. This analysis is not a recommendation to buy, sell, hold or sell short any security (stock ETF or otherwise). We all need to think for ourselves when it comes to trading our own accounts. First, it is the only way to really learn. Second, we are the only ones responsible for our decisions. Think of these charts as food for further analysis. Before making a trade, it is important to have a plan. Plan the trade and trade the plan. Among other things, this includes setting a trigger level, a target area and a stop-loss level. It is also important to plan for three possible price movements: advance, decline or sideways. Have a plan for all three scenarios BEFORE making the trade. Consider possible holding times. And finally, look at overall market conditions and sector/industry performance.

