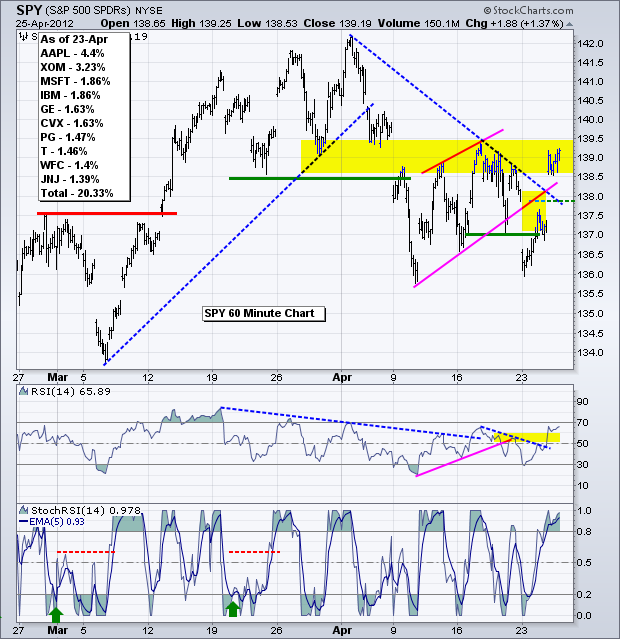
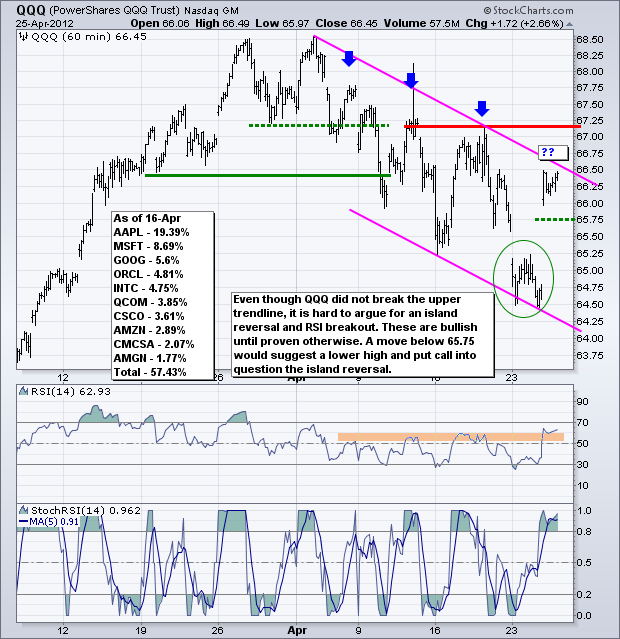
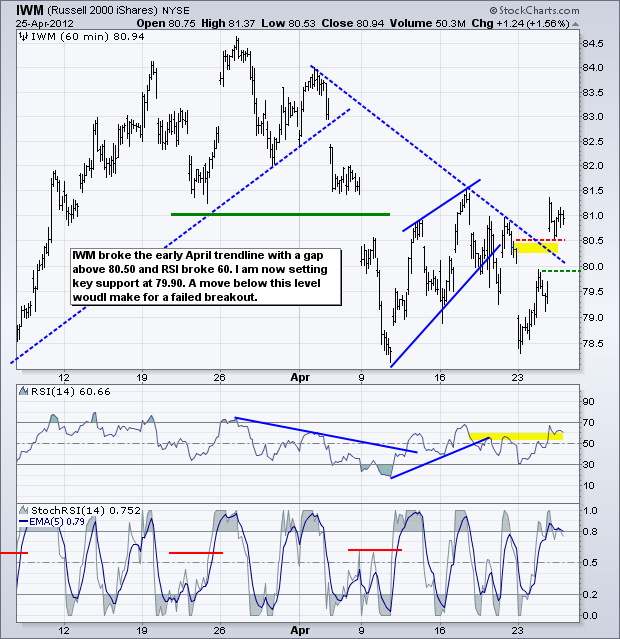
The Fed made another policy statement with little change in its outlook or wording. Apple produced another blow out quarter. Even though neither event produced a surprise, Apple's coattails provided a big lift for the market overall. Most, if not all, of the gains came before the Fed statement. All sectors were up with technology, materials and consumer discretionary leading the way. Industrials and finance lagged somewhat because both were up less than 1%. The market did not fire on all cylinders yesterday, but there was clearly more strength than weakness. On the 30-minute chart, the S&P 500 ETF (SPY) produced an island reversal with a gap down on Monday and a gap up on Wednesday. The second gap negates the first to give the bulls the short-term edge. Even so, I am not that confident because resistance is at hand in the 139-139.5 area. Resistance here stems from the early April support break, 9-Apr gap and last week's high. For now, I will treat the trendline break and gap as bullish until proven otherwise. A move below 137.9 would provide the first sign that Wednesday's surge was a fluke. A strong surge should hold. A weak surge will fold. RSI broke its trendline and moved above 60 to turn momentum bullish.
**************************************************************************
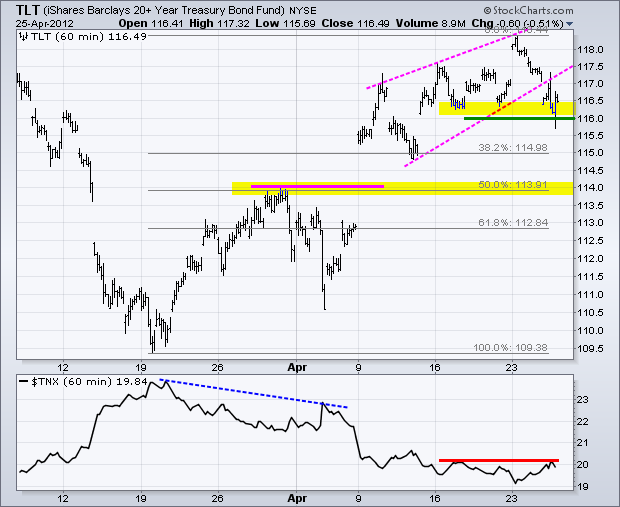
After a big run from 109.5 to 118 (7.7%), the 20+ Year T-Bond ETF (TLT) hit resistance from the late February high and backed off. TLT broke the wedge trendline and tested support at 116 with a sharp decline on Wednesday. Follow through below 116 would reverse this short-term uptrend and argue for a move to broken resistance around 114. A break down in treasuries would be bullish for stocks because treasuries and stocks are negatively correlated.
**************************************************************************
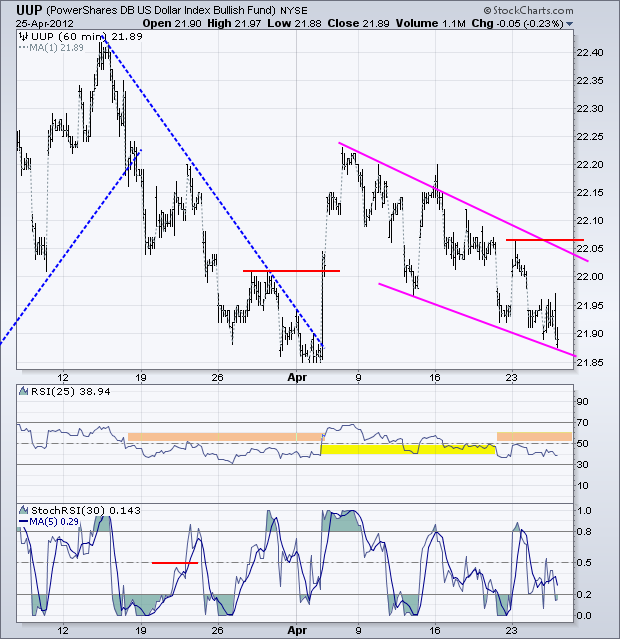
Forget about Spain, the European debt situation and the UK recession. Traders are selling Dollars. The US Dollar Fund (UUP) surged in early April and that was it. Sellers came in and pushed the greenback lower the last three weeks and the short-term trend is clearly down. It would take a move above the early April trendline and Monday's high to reverse this downtrend.
**************************************************************************
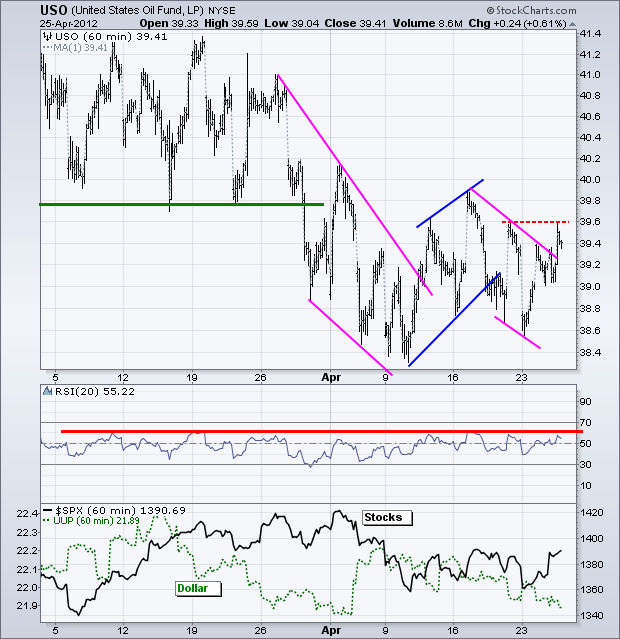
Commodities got a little pop after the Fed statement. Weakness in the Dollar, an accommodative Fed and a strong Basic Materials SPDR helped commodities on Wednesday. The US Oil Fund (USO) broke falling channel resistance with a surge above 39.40 and hit resistance from Friday's high. Follow through above this level is needed to fully reverse the trend here. Also look for an RSI break above 65.
**************************************************************************
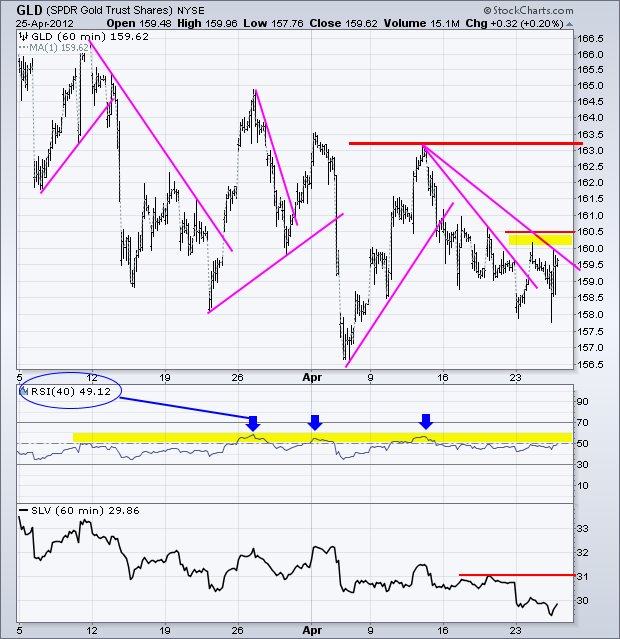
Gold is getting very interesting. The overall trend since late February remains down with a series of lower lows and lower highs. There are, however, some pretty good swings within this downtrend. The current swing is down, but the ETF is showing signs of firmness with two bounces in the 158 area. A follow through break above 160.50 would reverse this downswing. Look for an RSI break above 60 to confirm.
**************************************************************************
Key Economic Reports:
Thu - Apr 26 - 08:30 - Jobless Claims
Thu - Apr 26 - 10:00 – Pending Home Sales
Fri - Apr 27 - 10:00 - GDP
Fri - Apr 27 - 09:55 – Michigan Sentiment
Charts of Interest: Tuesday and Thursday in separate post.
This commentary and charts-of-interest are designed to stimulate thinking. This analysis is not a recommendation to buy, sell, hold or sell short any security (stock ETF or otherwise). We all need to think for ourselves when it comes to trading our own accounts. First, it is the only way to really learn. Second, we are the only ones responsible for our decisions. Think of these charts as food for further analysis. Before making a trade, it is important to have a plan. Plan the trade and trade the plan. Among other things, this includes setting a trigger level, a target area and a stop-loss level. It is also important to plan for three possible price movements: advance, decline or sideways. Have a plan for all three scenarios BEFORE making the trade. Consider possible holding times. And finally, look at overall market conditions and sector/industry performance.

