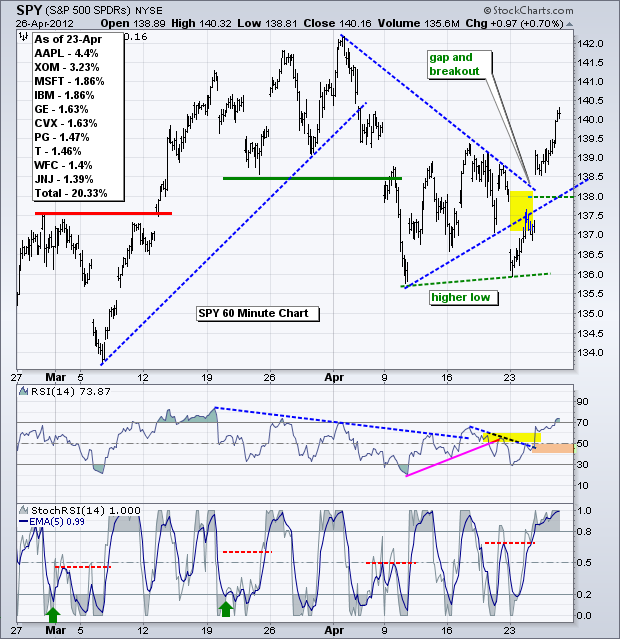
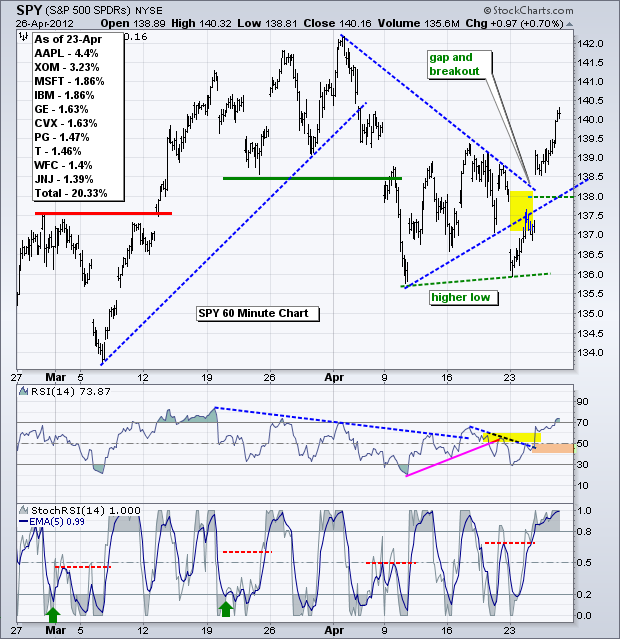
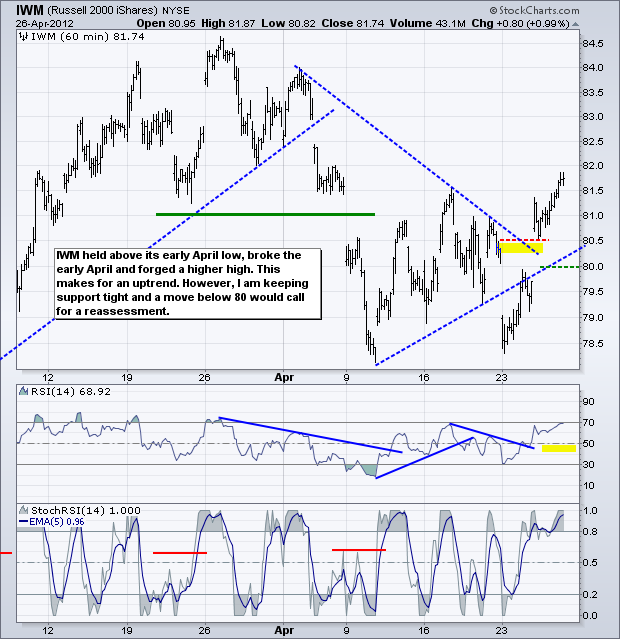
The island reversals, up gaps and breakouts are holding. QQQ formed a lower low early this week, but IWM and SPY held above their early April lows. In fact, the recovery after Monday's gap down was so swift that I am going to draw my trendlines right through it. This week's higher lows (SPY/IWM) were followed by breakouts that produced higher highs with the move above the mid April high. At this point, we have a medium-term uptrend on the daily charts and now a short-term uptrend on the intraday charts. The medium-term uptrend was never in jeopardy. Short-term, it is important that these gaps and breakouts hold. SPY gapped above 138.5, consolidated for a few hours and then continued higher. I am marking support rather tight at 138. A move back below this level would suggest that the bulls are getting cold feet and call for a reassessment. RSI moved above 70 for the first time since late March. Overbought is a sign of strength, not potential weakness. Once again, I will set RSI support at 40.
**************************************************************************
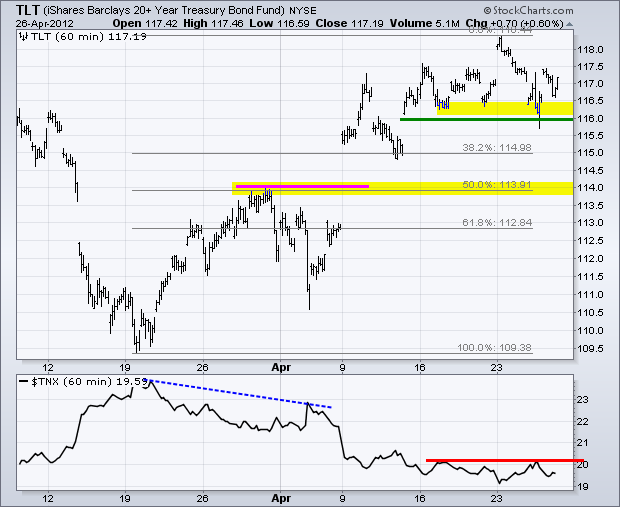
TLT remain stubborn and refuses to break support at 116. Also notice that the 10-year Treasury Yield ($TNX) refuses to break resistance from the mid April high. Resilience in treasuries is a big concern for the stock market. In fact, I think TLT needs to break support at 116 for the stock market rally to have legs. Next week is going to be big because we have jobless claims on Thursday and the big employment report on Friday. A worse-than-expected report would be bullish for treasuries, while a better-than-expected would be bearish.
**************************************************************************
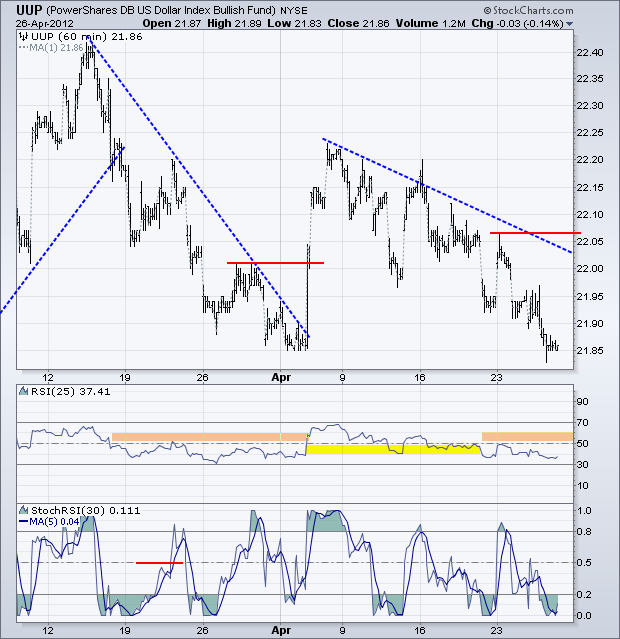
No change. Forget about Spain, the European debt situation and the UK recession. Traders are selling Dollars. The US Dollar Fund (UUP) surged in early April and that was it. Sellers came in and pushed the greenback lower the last three weeks and the short-term trend is clearly down. It would take a move above the early April trendline and Monday's high to reverse this downtrend.
**************************************************************************
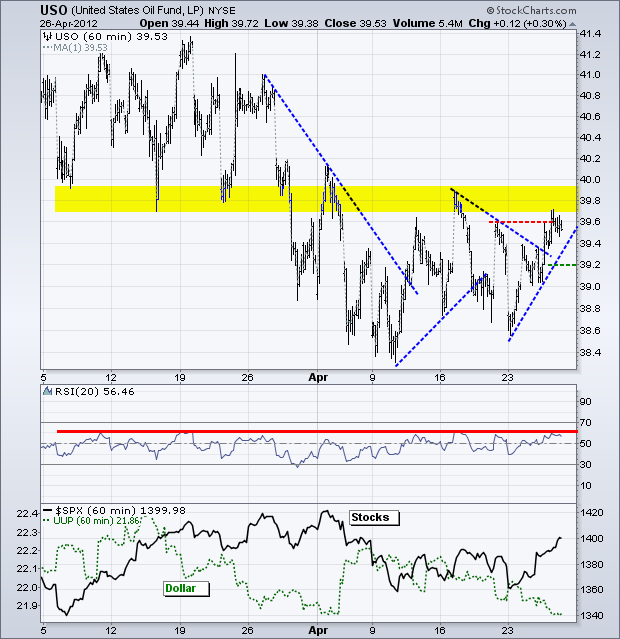
The US Oil Fund (USO) remains in a downtrend since late February and broke support in the 39.8 area at the end of March. This area turned into resistance in April and USO is once again testing this zone. The swing within the downtrend is up, but I am keeping support tight. A move below 39.20 would reverse this upswing and argue for a move to new lows. A lot will depend on the stock market. Continued strength in stocks would be positive for oil, but weakness in stocks and strength in treasuries would be bearish for crude.
**************************************************************************
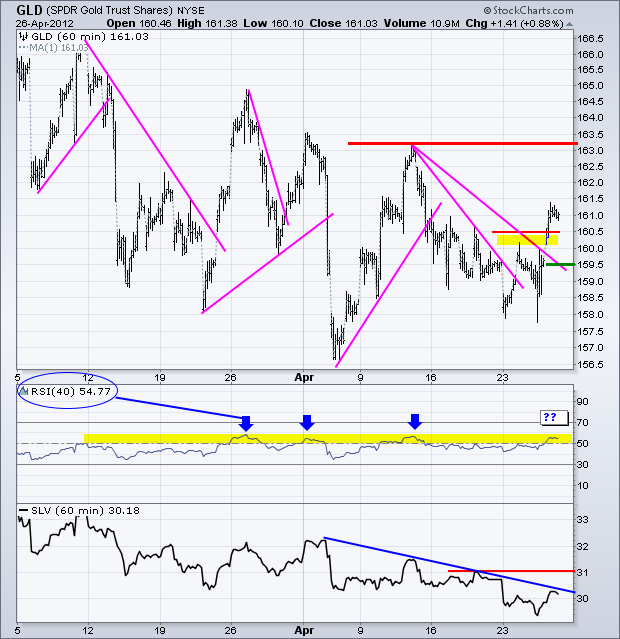
The Gold SPDR (GLD) surged above first resistance at 160.5 with a strong move on Thursday. With a higher low forming, the potential for a trend reversal is increasing. However, note that gold remains in a bigger downtrend still and RSI has yet to breakout. A break above the mid April high is needed to fully reverse this downtrend. At this point, we need to set a support level to cry "uncle" on this breakout. A move below 159.50 would signal a breakout failure.
**************************************************************************
Key Economic Reports:
Fri - Apr 27 - 10:00 - GDP
Fri - Apr 27 - 09:55 – Michigan Sentiment
Charts of Interest: Tuesday and Thursday in separate post.
This commentary and charts-of-interest are designed to stimulate thinking. This analysis is not a recommendation to buy, sell, hold or sell short any security (stock ETF or otherwise). We all need to think for ourselves when it comes to trading our own accounts. First, it is the only way to really learn. Second, we are the only ones responsible for our decisions. Think of these charts as food for further analysis. Before making a trade, it is important to have a plan. Plan the trade and trade the plan. Among other things, this includes setting a trigger level, a target area and a stop-loss level. It is also important to plan for three possible price movements: advance, decline or sideways. Have a plan for all three scenarios BEFORE making the trade. Consider possible holding times. And finally, look at overall market conditions and sector/industry performance.

