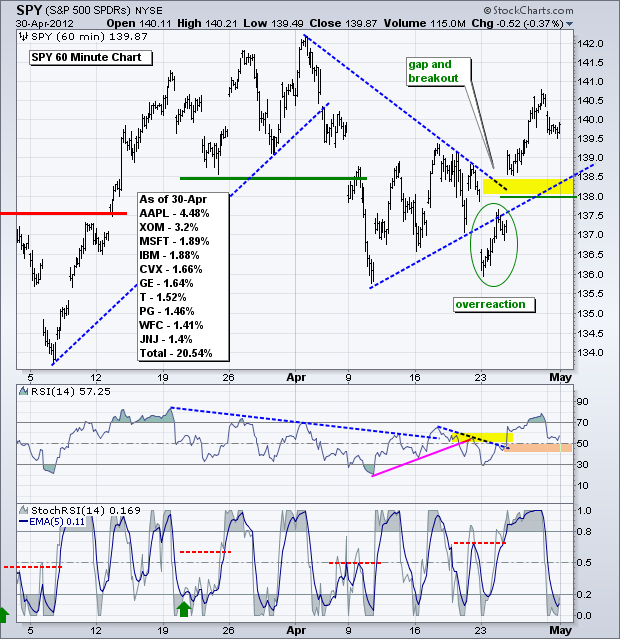
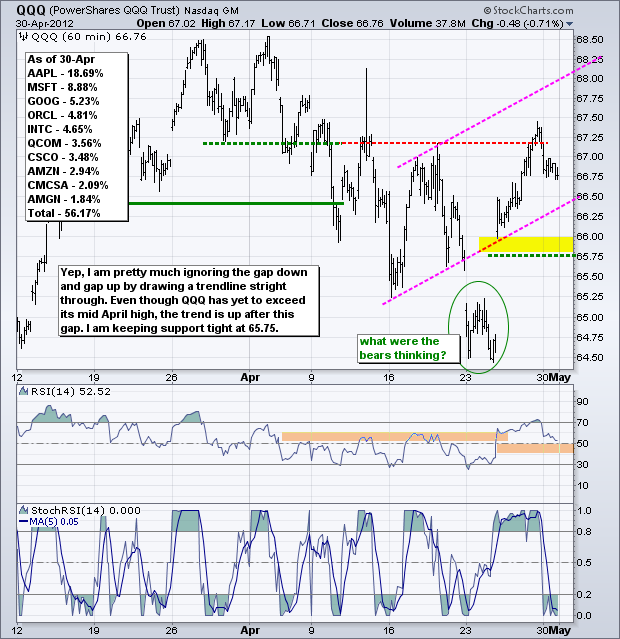
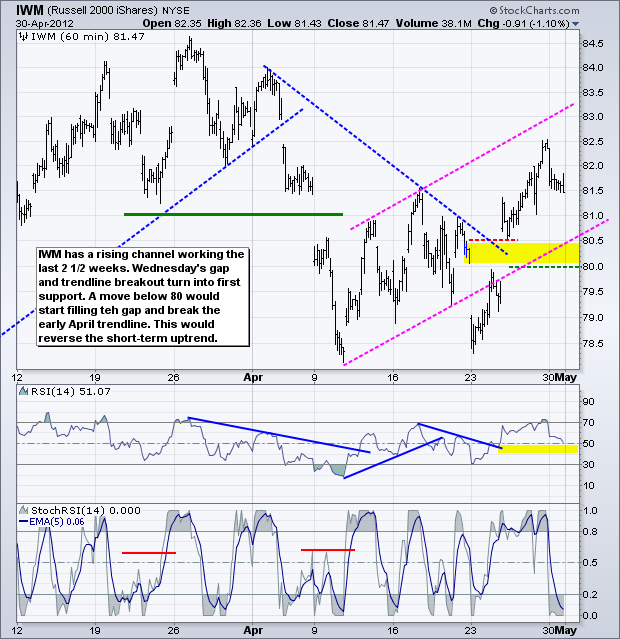
Stocks pulled back on Monday after the Chicago PMI came in below expectations and reached its lowest level since November 2009. Nevertheless, this key indicator came in at 56.20, which is well above 50 and indicative of economic expansion. Anything above 50 is positive. Don't forget that the economic onslaught continues today and extends to Friday's employment report. You can see all the key reports and times at the bottom of this commentary. The ISM Manufacturing Index is today's key report. Consensus is for 53, versus 52.40 in February. A worse-than-expected number could weigh on stocks and benefit bonds. Keep in mind that readings above 50 favor expansion and readings above 50 favor contraction. (After last week's gap and breakout, a little backing-and-filling is normal. The breakouts are holding and the major index ETFs remain short-term bullish as long as key support levels hold. SPY gapped and broke trendline resistance with a surge above 138.50. Because this three day reversal was so extreme and looks out of place, I am opting to draw a trendline right through the gap zone to define the short-term uptrend. At this point, the gap zone, trendline break and trendline extending up from early April mark first support at 138. A pullback or consolidation is allowed after the breakout, but a move below 138 would be deemed too far and call for a reassessment.
**************************************************************************
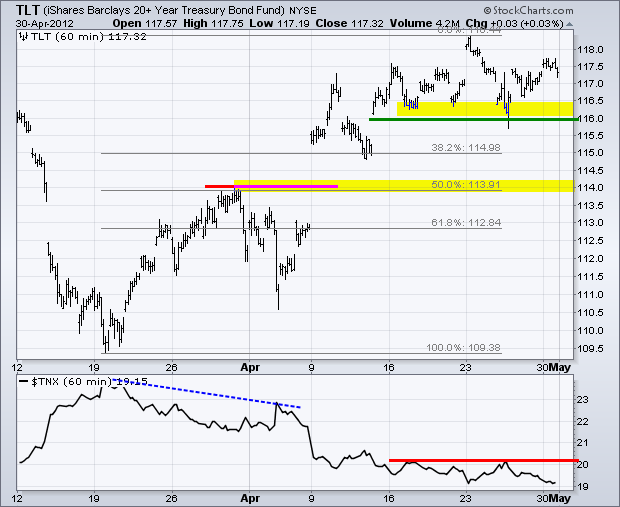
A worse-than-expected Chicago PMI and relatively weak stock market put a bid into treasuries, but the bid (buying pressure) was not very strong as the 20+ Year T-Bond ETF (TLT) closed just fractionally higher. TLT remains in a consolidation within a bigger uptrend. After breaking 117 in mid April, the ETF traded flat with support at 116, which is the level to watch going forward. A support break would be bearish for treasuries and bullish for stocks.
**************************************************************************
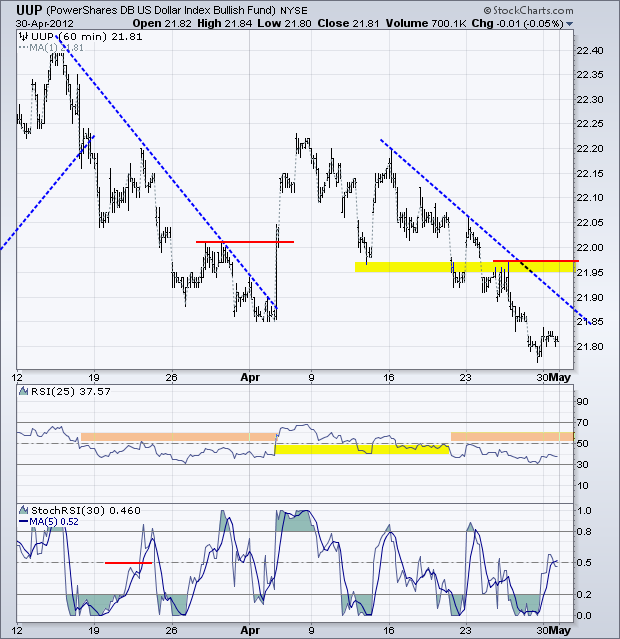
The Dollar continues to sink and remains in a clear downtrend. Except for a three day pop the first week of April, the greenback has been under persistent selling pressure the last seven weeks. The mid April trendline and broken support combine to mark first resistance in the 21.95 area. A strong surge above this level is needed to reverse the short-term downtrend.
**************************************************************************
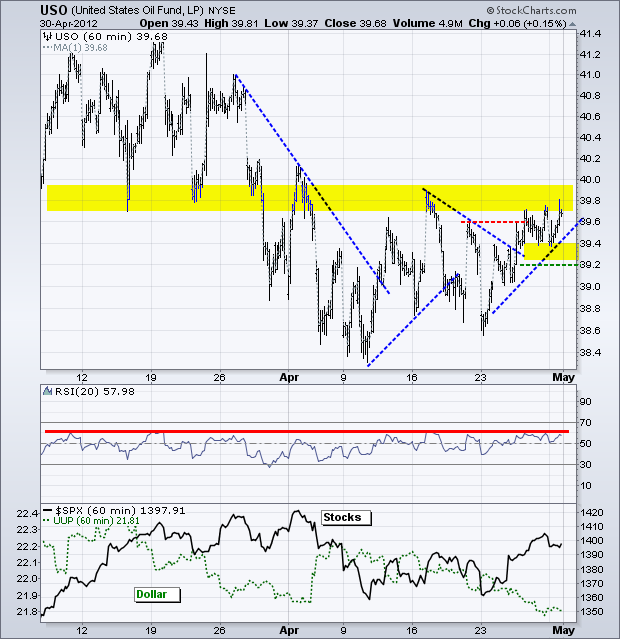
Despite weakness in the stock market, the US Oil Fund (USO) managed a fractional gain to hold its upswing. The ETF is currently challenging resistance from broken support in the 39.80 area. The blue trendlines mark the swings over the last five weeks and the current swing is up with support marked at 39.20. RSI is challenging resistance at 65 and a breakout would turn momentum bullish for the first time since late February.
**************************************************************************
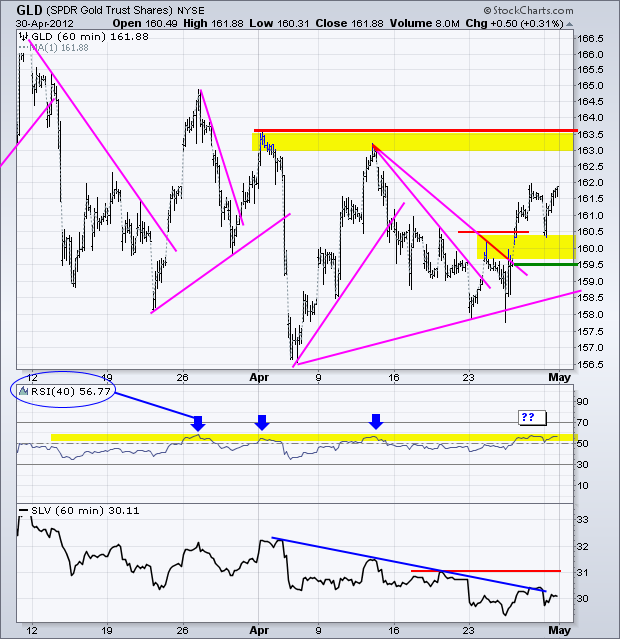
The Gold SPDR (GLD) opened weak, but quickly recovered and closed above 161.50 on Monday. This is impressive. Continued weakness in the Dollar is positive for gold. Also note that further gains in stocks would be positive. On the price chart, GLD is holding the breakout and broken resistance in the 159.5-160.5 area turns into support. The April highs mark the next resistance zone. RSI is challenging its resistance zone in the 50-60 area for the fourth time since late March.
**************************************************************************
Key Economic Reports:
Mon - May 01 - 10:00 - ISM Manufacturing Index
Tue - May 01 - 10:00 - Construction Spending
Tue - May 01 - 14:00 - Auto-Truck Sales
Wed - May 02 - 07:00 - MBA Mortgage Index
Wed - May 02 - 08:15 – ADP Employment Report
Wed - May 02 - 10:00 - Factory Orders
Wed - May 02 - 10:30 - Oil Inventories
Thu - May 03 - 07:30 - Challenger Job Cuts Report
Thu - May 03 - 08:30 - Initial Jobless Claims
Thu - May 03 - 10:00 - ISM Services Index
Fri - May 04 - 08:30 - Employment Report
Charts of Interest: Tuesday and Thursday in separate post.
This commentary and charts-of-interest are designed to stimulate thinking. This analysis is not a recommendation to buy, sell, hold or sell short any security (stock ETF or otherwise). We all need to think for ourselves when it comes to trading our own accounts. First, it is the only way to really learn. Second, we are the only ones responsible for our decisions. Think of these charts as food for further analysis. Before making a trade, it is important to have a plan. Plan the trade and trade the plan. Among other things, this includes setting a trigger level, a target area and a stop-loss level. It is also important to plan for three possible price movements: advance, decline or sideways. Have a plan for all three scenarios BEFORE making the trade. Consider possible holding times. And finally, look at overall market conditions and sector/industry performance.

