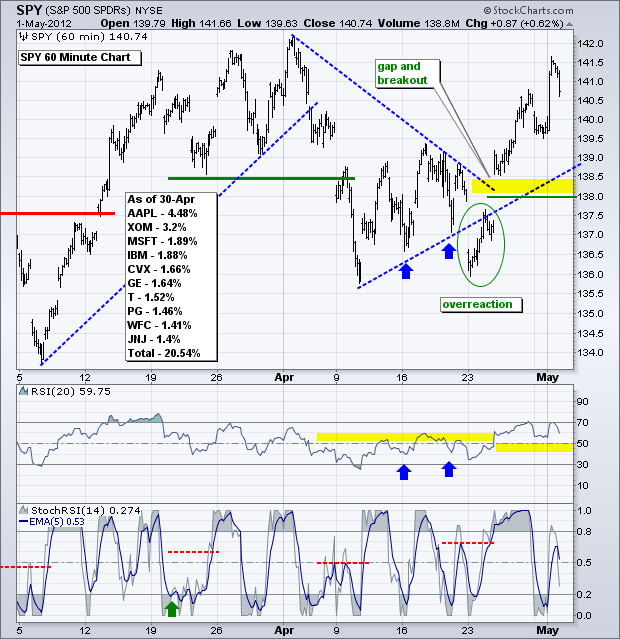
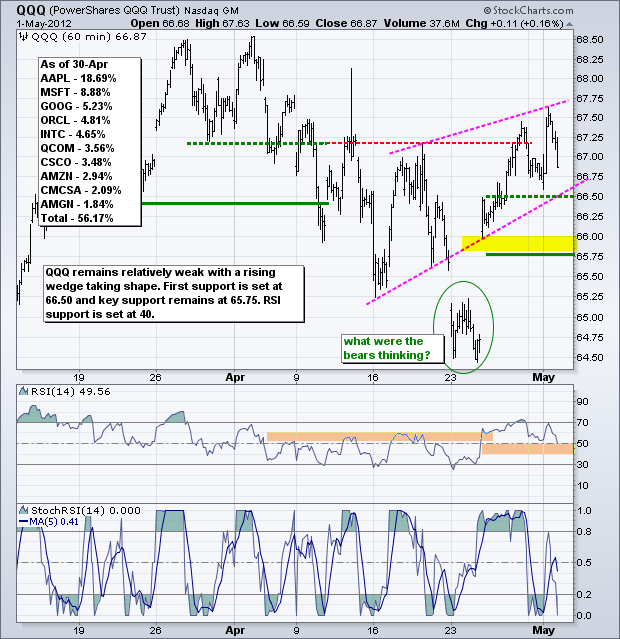
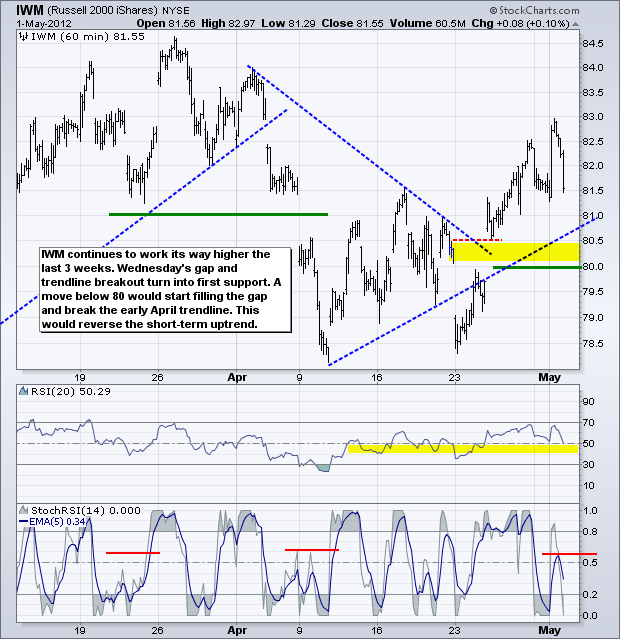
It was pop and drop for stocks on Tuesday. Stocks surged on the heels of a better-than-expected ISM Manufacturing Index, but failed to hold early gains and fell sharply in the final hour. Small-caps (Russell 2000) and techs (Nasdaq) led the way lower. Traders may be getting cold feet ahead of the employment-related reports on Wednesday, Thursday and Friday. The S&P 500 ETF (SPY) remains in a short-term uptrend with a series of higher highs and higher lows since the second week of April. Yes, I am still ignoring last week's island reversal and drawing a trendline right through the gap. This trendline and the top of the gap zone mark key support at 138 for now. I am also making an RSI adjustment to fit the three week uptrend. RSI is now set at 20-periods because this setting insures that the momentum oscillator holds 40 during dips the third week of April (blue arrows). A move below 40 would now turn momentum bearish.
**************************************************************************
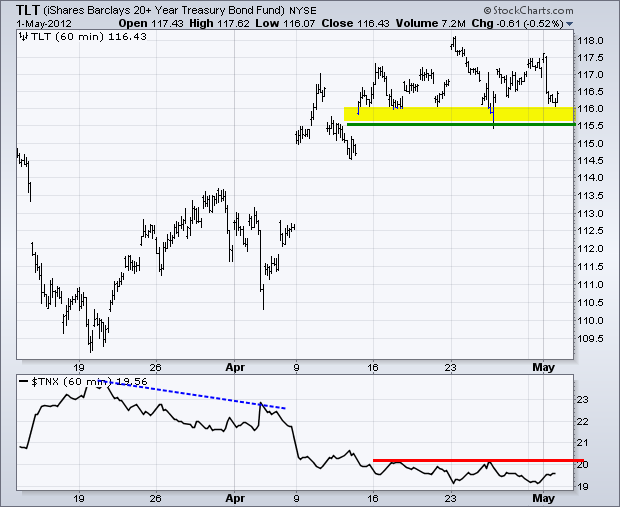
A better-than-expected ISM Index hit the treasury market hard as the 20+ Year T-Bond ETF (TLT) fell to the top of its support zone (115.5-116). The ETF has held this zone the last two weeks and this week's employment data will likely mark the make-or-break point. Strong employment numbers would be bearish and produce a support break. Weak employment numbers would be bullish and trigger a surge off support.
**************************************************************************
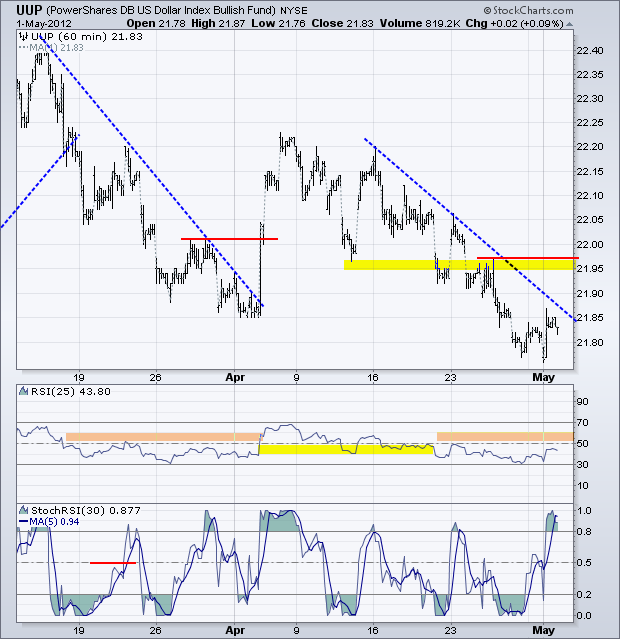
The news-cycle for the Dollar could turn positive after the employment report. At the very least, the US side of the news cycle will turn neutral once this week's economic onslaught passes. Currency traders may then turn their attention to the second round of the French elections, which are scheduled for Sunday. Hollande is the clear front-runner and a loss by incumbent Sarkozy would throw a little uncertainty into the EU mix. The cozy Merkozy (Merkel-Sarkozy) alliance would be replaced with awkward duo. The US Dollar Fund (UUP) remains in a clear downtrend though. Key resistance remains at 21.97 and RSI resistance at 60.
**************************************************************************
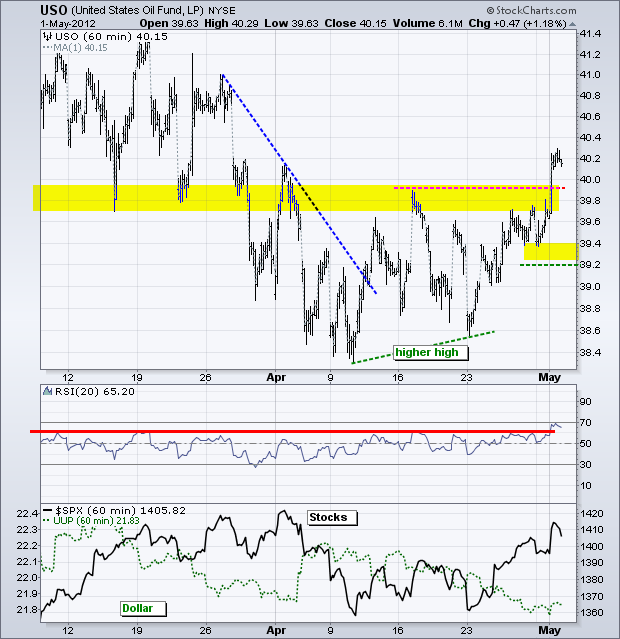
Houston, we have a breakout. The US Oil Fund (USO) surged above 40 and broke above its mid April high. This move also places USO above broken support and the trend since the second week of April is up. Note the higher low last week and this week's higher high. Also note that RSI broke above 65 for the first time since late February. I am keeping support at 39.20 for now. A move below this level would mark a breakout failure and put the bears back in the driver's seat. Oil could be reacting to the strong ISM Index and further strength in the economic numbers would be bullish for oil demand.
**************************************************************************
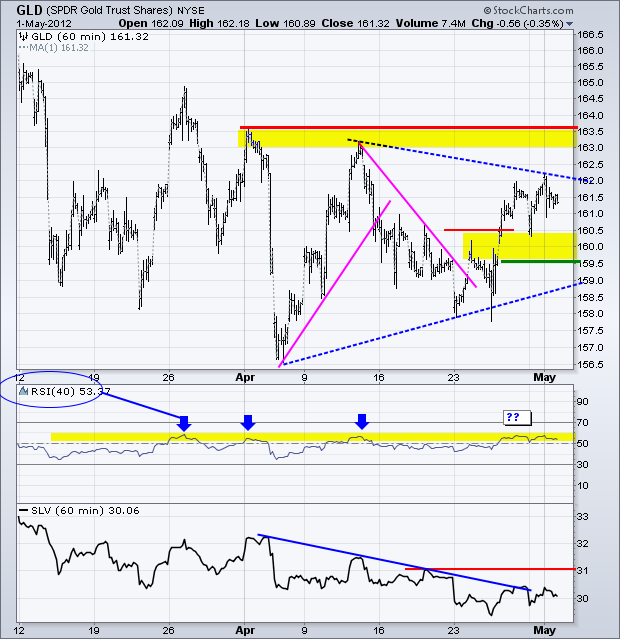
The Gold SPDR (GLD) surged above 160.50 to reverse the downswing last week, but hit resistance below the early April highs. A lower high around 162 would indicate that a triangle is taking shape. For now, the upswing remains in play and the bulls have a slight edge (short-term). Medium-term, the trend is still down because the April highs have yet to be broken. Also note that momentum remains stubbornly bearish as RSI has yet to break its resistance zone. I am keeping key support at 159.50, a break of which would clearly reverse the upswing.
**************************************************************************
Key Economic Reports:
Wed - May 02 - 07:00 - MBA Mortgage Index
Wed - May 02 - 08:15 – ADP Employment Report
Wed - May 02 - 10:00 - Factory Orders
Wed - May 02 - 10:30 - Oil Inventories
Thu - May 03 - 07:30 - Challenger Job Cuts Report
Thu - May 03 - 08:30 - Initial Jobless Claims
Thu - May 03 - 10:00 - ISM Services Index
Fri - May 04 - 08:30 - Employment Report
Charts of Interest: Tuesday and Thursday in separate post.
This commentary and charts-of-interest are designed to stimulate thinking. This analysis is not a recommendation to buy, sell, hold or sell short any security (stock ETF or otherwise). We all need to think for ourselves when it comes to trading our own accounts. First, it is the only way to really learn. Second, we are the only ones responsible for our decisions. Think of these charts as food for further analysis. Before making a trade, it is important to have a plan. Plan the trade and trade the plan. Among other things, this includes setting a trigger level, a target area and a stop-loss level. It is also important to plan for three possible price movements: advance, decline or sideways. Have a plan for all three scenarios BEFORE making the trade. Consider possible holding times. And finally, look at overall market conditions and sector/industry performance.


