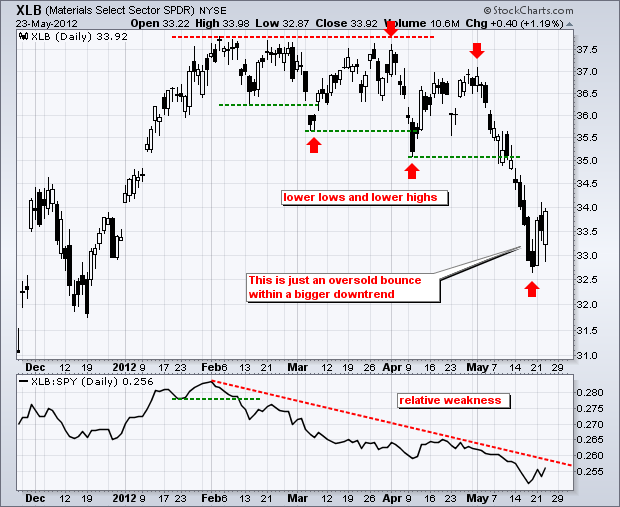
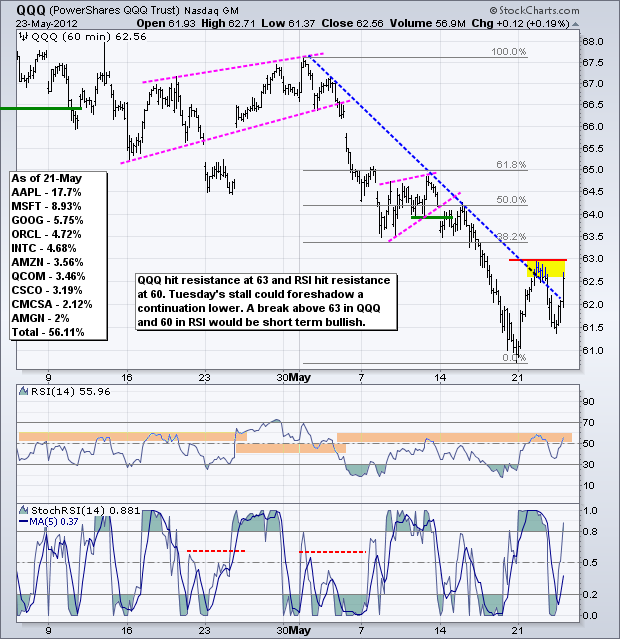
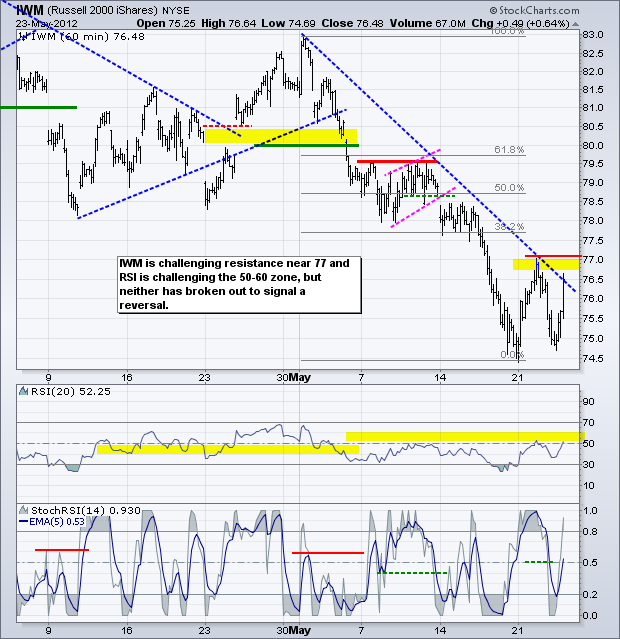
Let the roller coaster ride begin! Stocks started the day weak with the major index ETFs falling over 1% in the first two hours of trading. After firming for a few hours, stocks moved sharply higher in afternoon trading. Most of the major index ETFs closed with small gains. The Russell 2000 ETF (IWM) edged up .49% and the S&P MidCap 400 SPDR (MDY) gained a respectable .97% on the day. Six of the nine sectors were up with the three defensive sectors falling (consumer staples, healthcare and utilities). The materials sector led the leaders with a 1.19% gain. Trading is likely to be very tricky as rumors and volatility increase. The bigger trend for stocks is now down and I am suspending "Charts of Interest" until things settle down.
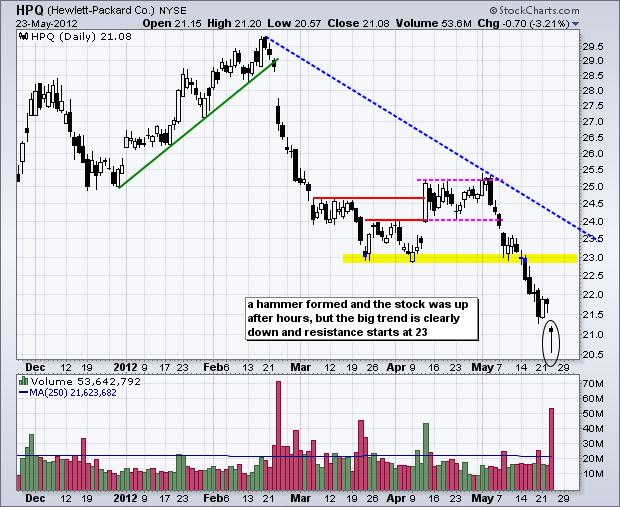
Why the bounce and why now? There were probably some rumors swirling on the EU summit, which was really just a dinner for the heads of state. Perhaps the market got wind that HP would beat on earnings and guide higher for the full year. The shares were up after hours, but traders should note that HP guided lower for the third quarter and announced plans to lay off some 8% of its workforce (27,000 employees). The price chart for HP tells the real story as the stock hit a new 52 week low yesterday and remains in a clear downtrend.
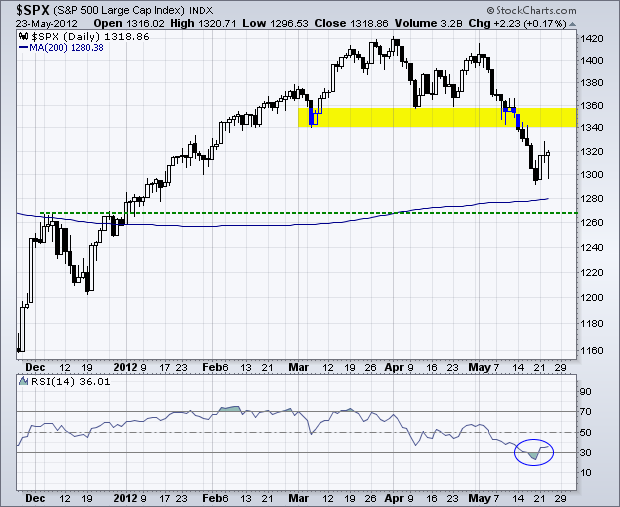
Perhaps institutions are focusing on the 1300 level for the S&P 500. The index bounced off this level Monday, stalled on Tuesday and then tested this level with Wednesday's low. Overall, I still think this is a mere consolidation within a bigger decline. $SPX was oversold with last week's close below 1300 as RSI moved below 30 for the first time since August. A few days or sideways action will work off this oversold condition and we might then see a continuation lower. Keep in mind that we have yet to see a selling climax. My hunch is that $SPX will break the 200-day and the media will be all over this story. We might then see a selling climax to prepare the way for an oversold bounce.
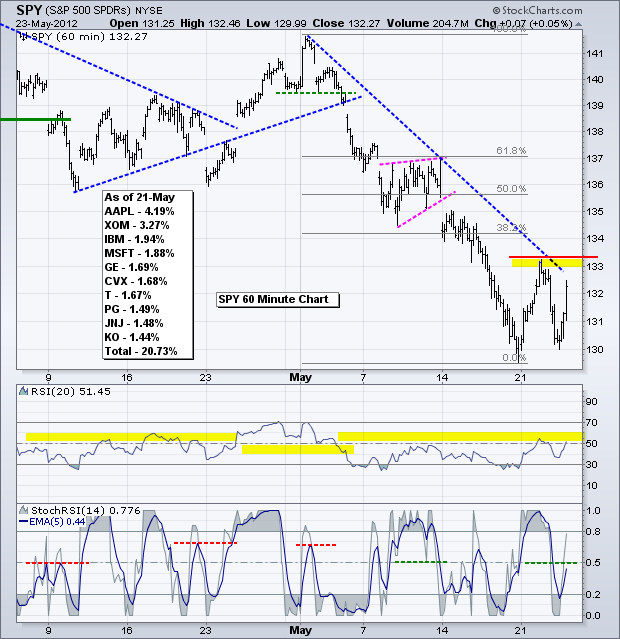
On the 60-minute chart, SPY stared to continue lower, but bounced off 130 and closed above 132. Such volatility can be expected as central authorities around the world try to prevent an economic slowdown and European catastrophe. Despite this surge, resistance just above 133 remains and follow through above this level is needed to reverse the downtrend. RSI is also testing resistance in the 50-60 zone again. The 5-day EMA for StochRSI moved below .50 to trigger a short-term sell signal. Sitting through a rumor-induced pop is difficult, but I expect the downtrend to continue as long as resistance holds.
**************************************************************************
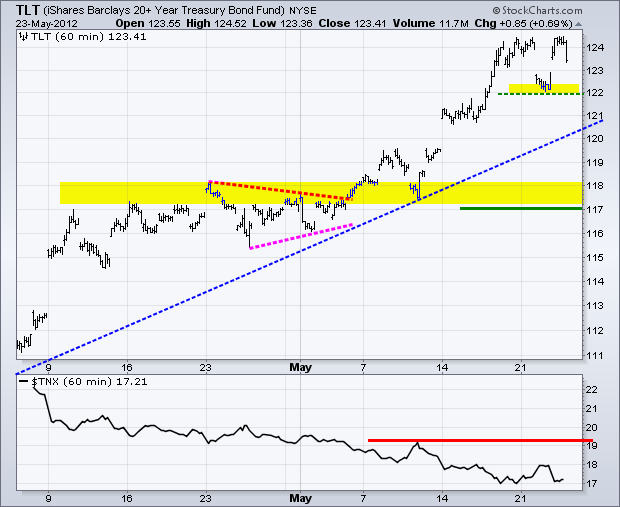
The 20+ Year T-Bond ETF (TLT) surged above 124, but fell back as the stock market surged in the afternoon. Nevertheless, this pullback is a mere blip in a disturbingly strong uptrend. The 10-year Treasury Yield ($TNX) is trading at 20 year lows and money is still moving into treasuries, which yield less than 1.8%. At best, treasuries are signaling slow growth or perhaps even a recession. At worst, deflation could be in the air.
**************************************************************************
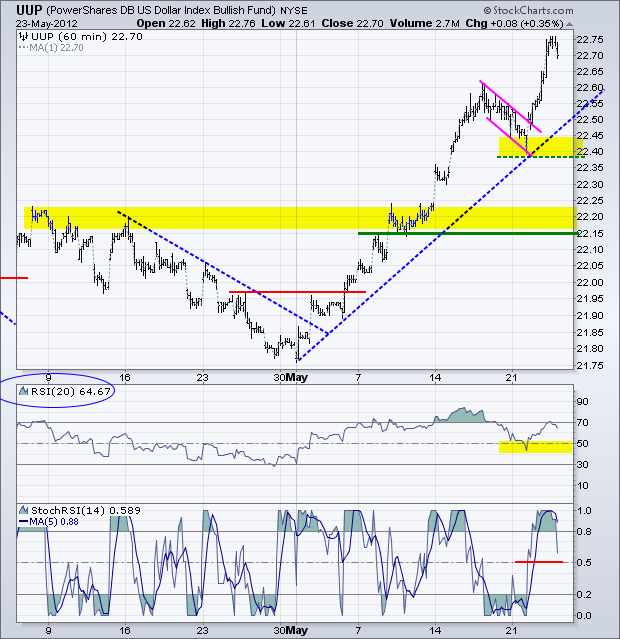
No change. The US Dollar Fund (UUP) pulled back on Friday-Monday and then surged to a new high on Tuesday. Talk about a short pullback. RSI found support in the 40-50 zone and StochRSI surged above .50 to signal a resumption of the uptrend. First support is now set at 22.33 and key support at 22.15.
**************************************************************************
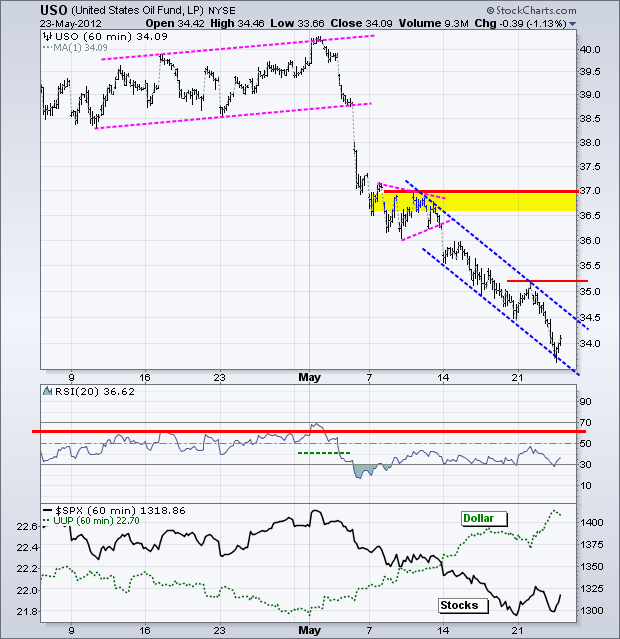
The US Oil Fund (USO) sank further on Wednesday and became even more oversold. Pervasive weakness in oil also suggests an economic slowing or perhaps even a recession. Also note that the sharp decline energy prices is more deflationary than inflationary. USO remains in a tight falling price channel with first resistance just above 35.
**************************************************************************
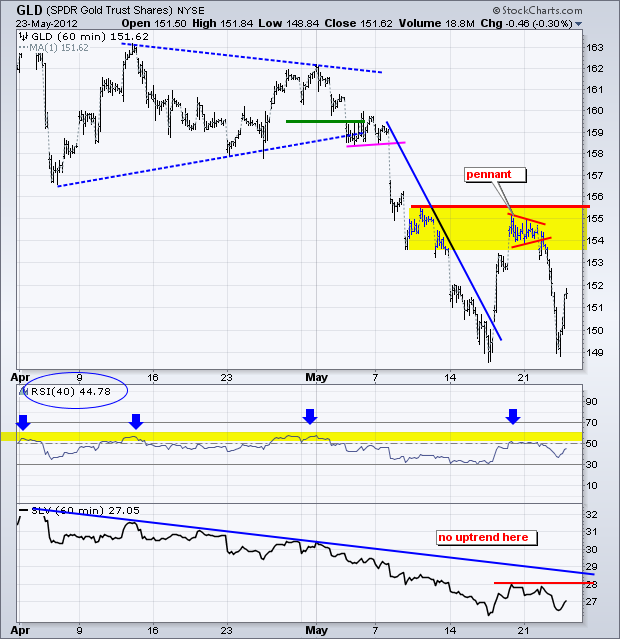
No change. Once again, 40-period RSI hit resistance in the 50-60 zone and the Gold SPDR (GLD) turned lower to continue its downtrend. RSI at this setting has defined the downtrend since late March. A break above 60 is needed to turn momentum bullish. On the price chart, GLD formed a pennant, but broke support instead of resistance. This marks another failure and keeps the bigger downtrend alive. We can now set key resistance at 155.50.
**************************************************************************
Key Economic Reports:
Thu - May 24 - 08:30 - Jobless Claims
Thu - May 24 - 08:30 - Durable Orders
Fri - May 25 - 09:55 - Michigan Sentiment
Sun - Jun 17 - 10:00 – Greek Elections
Sun - Jun 28 - 10:00 – 2-day EU Summit
Charts of Interest: Trading is likely to be very tricky as rumors and volatility increase. The bigger trend for stocks is now down and I am suspending Charts of Interest until things settle down.
This commentary and charts-of-interest are designed to stimulate thinking. This analysis is not a recommendation to buy, sell, hold or sell short any security (stock ETF or otherwise). We all need to think for ourselves when it comes to trading our own accounts. First, it is the only way to really learn. Second, we are the only ones responsible for our decisions. Think of these charts as food for further analysis. Before making a trade, it is important to have a plan. Plan the trade and trade the plan. Among other things, this includes setting a trigger level, a target area and a stop-loss level. It is also important to plan for three possible price movements: advance, decline or sideways. Have a plan for all three scenarios BEFORE making the trade. Consider possible holding times. And finally, look at overall market conditions and sector/industry performance.

