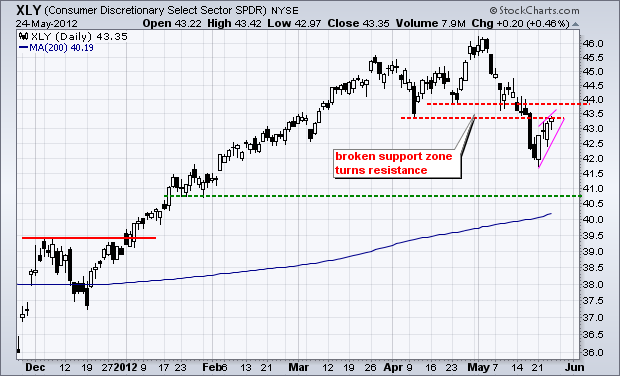
After meandering for most of the day Thursday, stocks caught a late bid and moved higher in the final hour. Except for the Nasdaq 100 ETF (QQQ), which closed down .66%, the major index ETFs were slightly higher on the day. The sectors were mixed with the Technology SPDR (XLK) leading the three losers (-.57%) and the Healthcare SPDR (XLV) leading the six winners (+.97%). The Consumer Staples SPDR (XLP) was also strong with a .95% gain on the day. The Consumer Discretionary SPDR (XLY) is nearing its moment-of-truth as it returns to broken support, which turns into resistance. A steep rising flag or wedge may be taking shape.
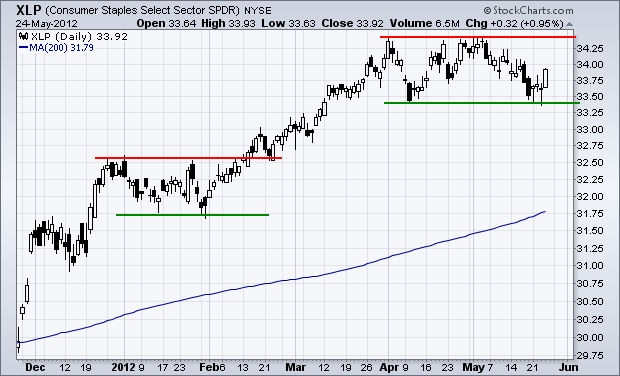
Relative strength in the Consumer Staples SPDR (XLP) can be seen just by looking at the chart. Notice how XLP held support from the April low and XLY broke support from the same low. XLP firmed the prior three days and surged off support with a relatively big move on Thursday. Overall, the three defensive sectors continue to show relative strength (utilities, consumer staples and healthcare).
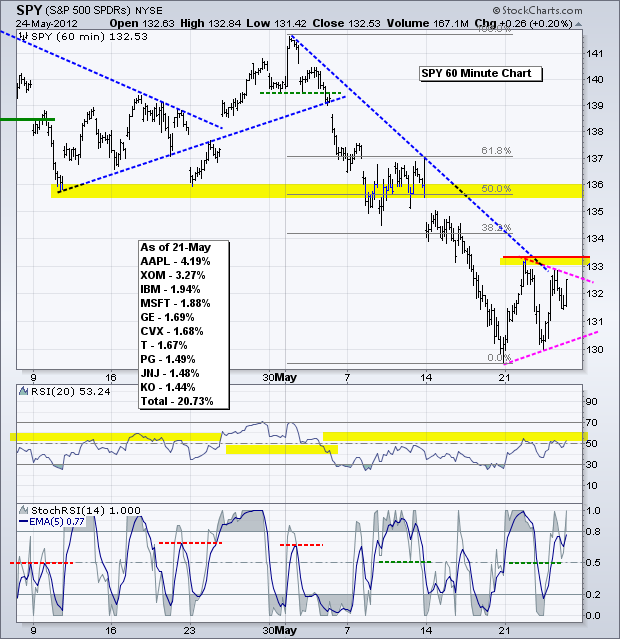
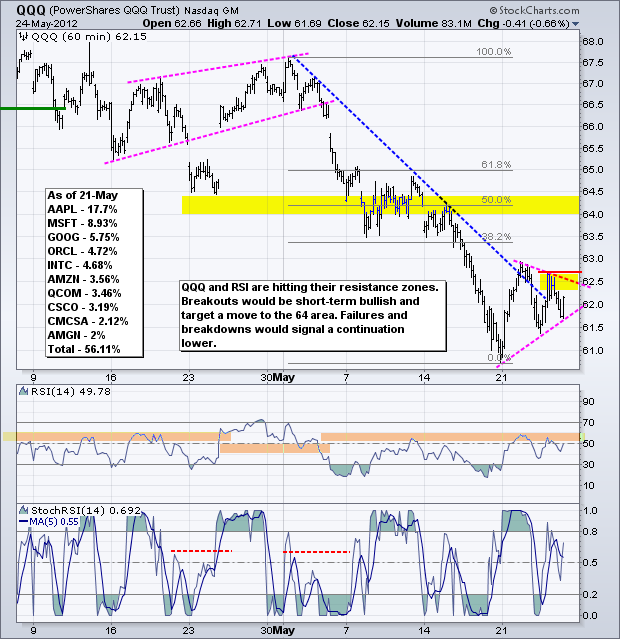
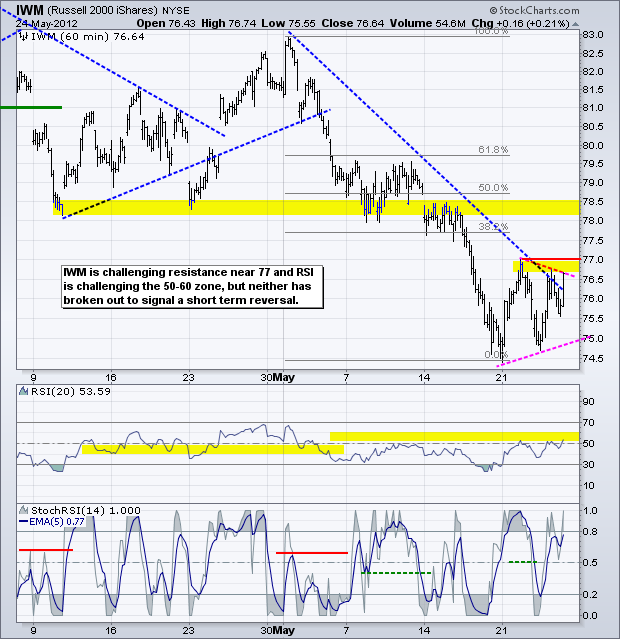
Turning to the broader market, the short-term trends remain down for the major index ETFs and all three are consolidating within these downtrends. On the 60-minute chart, SPY has a triangle or pennant taking shape. These are typically continuation patterns that mark a rest within the ongoing trend, which is down. A break below 130 would signal a continuation lower and target further weakness towards the 125 area. Chartists should keep in mind that there is also a chance for an upside breakout, which would target a move toward the 135-136 area. RSI is in its resistance zone and a break above 60 would be bullish. Keep in mind that the powers that be will say everything they can to placate the markets. I would not expect too much out of Europe in the next four days because Monday is a holiday (Pentecost) in Germany, France, Belgium, the Netherlands and many other EU countries.
**************************************************************************
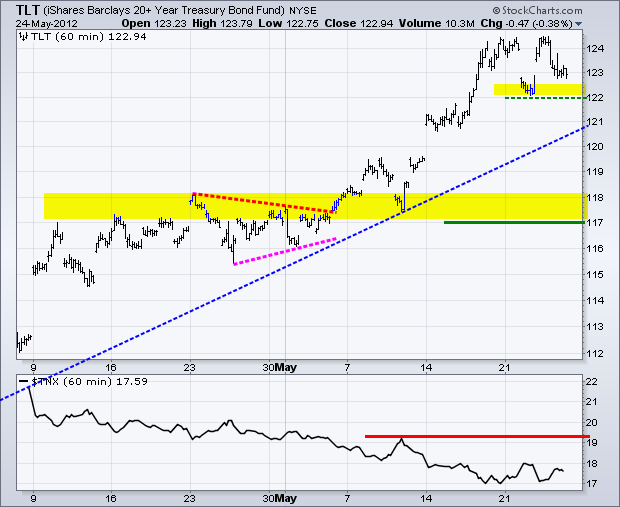
The 20+ Year T-Bond ETF (TLT) moved into a high level consolidation as stocks moved into low-level consolidations. While a break below first support at 122 would be negative, I would not view this as a trend-reversing event. TLT is entitled to a correction after its sharp run-up and could correct back to the 120-121 area. I will leave key support at 117 for now.
**************************************************************************
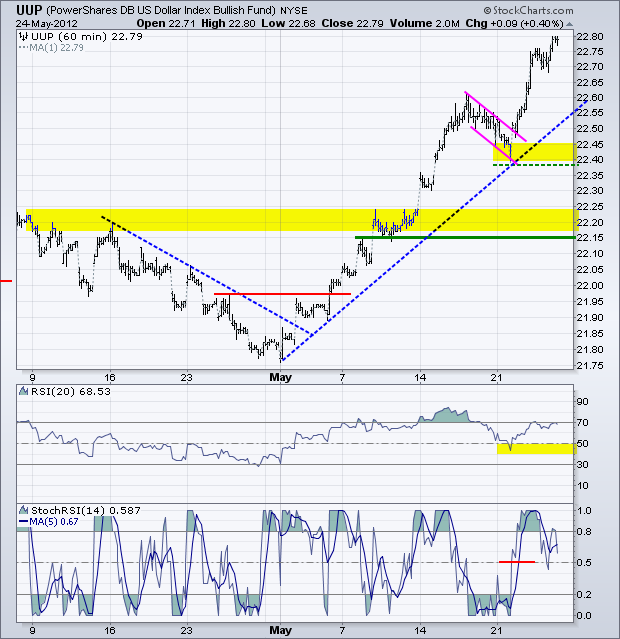
No change. The US Dollar Fund (UUP) pulled back on Friday-Monday and then surged to new highs this week. Talk about a short pullback. RSI found support in the 40-50 zone and StochRSI surged above .50 early Tuesday to signal a resumption of the uptrend. First support is now set at 22.33 and key support at 22.15.
**************************************************************************
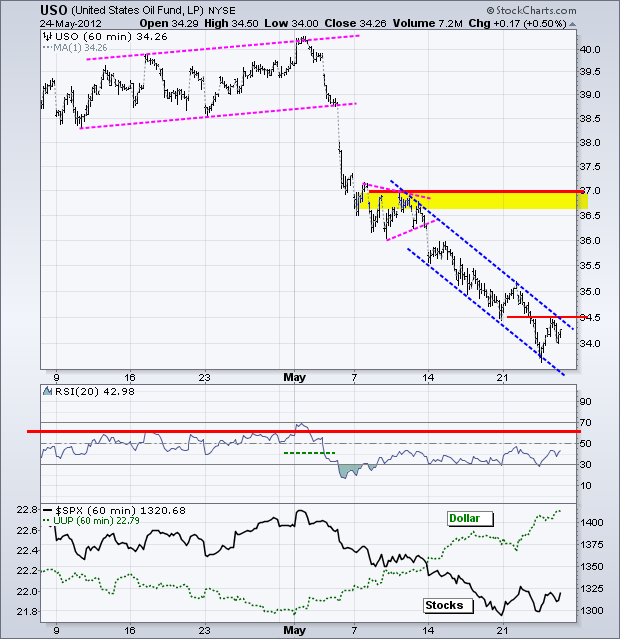
No change. The US Oil Fund (USO) sank further this week and became even more oversold. Pervasive weakness in oil also suggests an economic slowing or perhaps even a recession. Also note that the sharp decline energy prices is more deflationary than inflationary. USO remains in a tight falling price channel with first resistance just above 35.
**************************************************************************
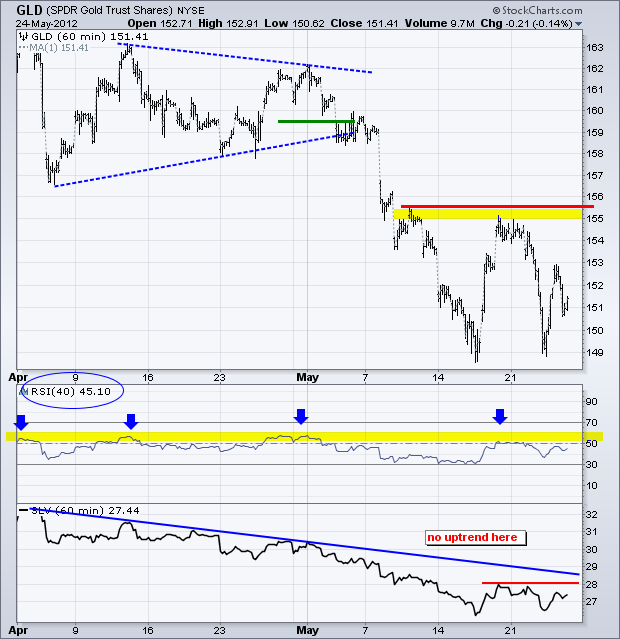
The Gold SPDR (GLD) moved into a volatile consolidation zone the last two weeks with support around 149 and resistance around 155.50. The medium-term trend (daily chart) is clearly down and the short-term trend (60-minute chart) is also down because of the big support break in early May. Key resistance is set at 155.5 and a break above this level would be short-term bullish. This could also have medium-term consequences because support around 149 extends back to December. There is even a bottom picking play right now. Just make sure to use your stops are in place.
**************************************************************************
Key Economic Reports:
Fri - May 25 - 09:55 - Michigan Sentiment
Sun - Jun 04 - 10:00 – Greek Holiday
Sun - Jun 17 - 10:00 – Greek Elections
Sun - Jun 28 - 10:00 – 2-day EU Summit
Charts of Interest: Trading is likely to be very tricky as rumors and volatility increase. The bigger trend for stocks is now down and I am suspending Charts of Interest until things settle down.
This commentary and charts-of-interest are designed to stimulate thinking. This analysis is not a recommendation to buy, sell, hold or sell short any security (stock ETF or otherwise). We all need to think for ourselves when it comes to trading our own accounts. First, it is the only way to really learn. Second, we are the only ones responsible for our decisions. Think of these charts as food for further analysis. Before making a trade, it is important to have a plan. Plan the trade and trade the plan. Among other things, this includes setting a trigger level, a target area and a stop-loss level. It is also important to plan for three possible price movements: advance, decline or sideways. Have a plan for all three scenarios BEFORE making the trade. Consider possible holding times. And finally, look at overall market conditions and sector/industry performance.

About the author:
Arthur Hill, CMT, is the Chief Technical Strategist at TrendInvestorPro.com. Focusing predominantly on US equities and ETFs, his systematic approach of identifying trend, finding signals within the trend, and setting key price levels has made him an esteemed market technician. Arthur has written articles for numerous financial publications including Barrons and Stocks & Commodities Magazine. In addition to his Chartered Market Technician (CMT) designation, he holds an MBA from the Cass Business School at City University in London.
Learn More
