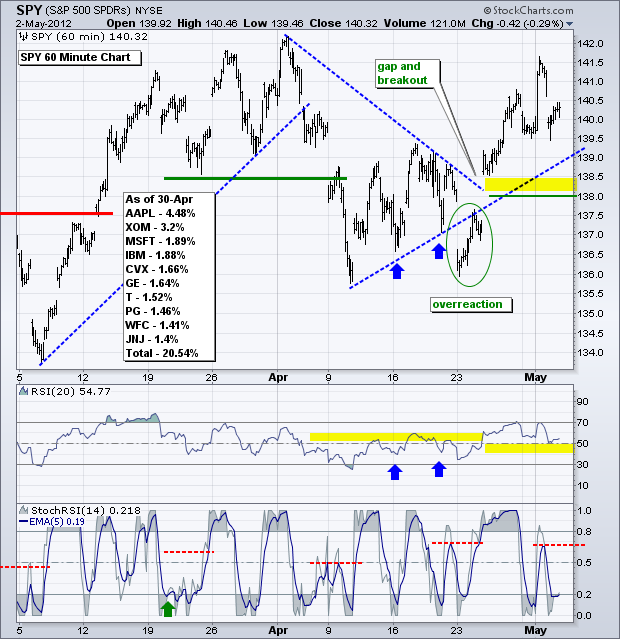
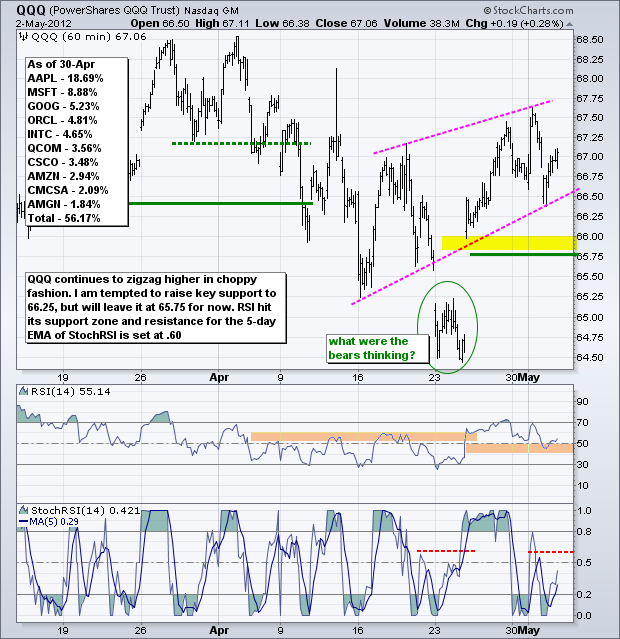
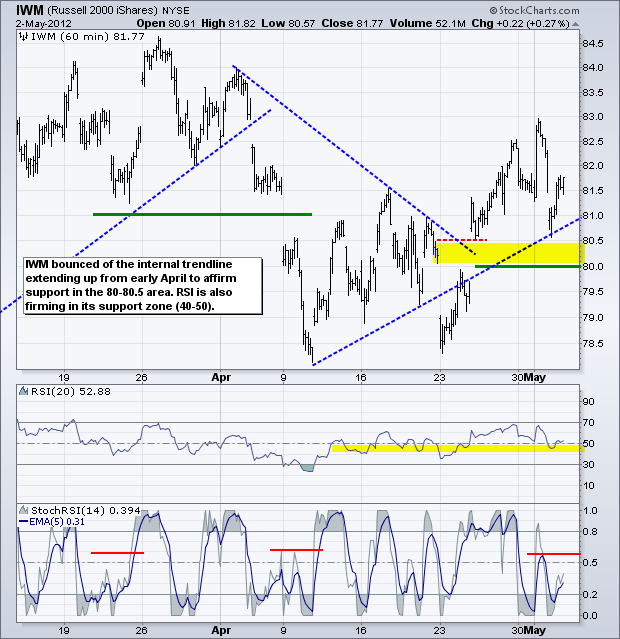
Stocks opened weak after the ADP Employment report came in below expectations. Nevertheless, the market firmed and worked its way higher the rest of the day. Small-caps (Russell 2000) and techs (Nasdaq) finished with small gains, the S&P 500 and Dow ended the day with small losses. All in all, it was a mixed market on Wednesday. Sector action was also mixed with the consumer discretionary and consumer staples sectors leading the way higher. What an odd pair! These two represent different ends of the economic spectrum. The consumer discretionary sector represents optional spending (clothes, electronics, restaurants), while the consumer staples represents obligatory spending (soap, toothpaste, medicine, beer). The Consumer Discretionary SPDR (XLY) hit a new 52-week high on Wednesday and continues to lead the market. The Consumer Staples SPDR (XLP) is close to a 52-week high as it challenges resistance from the April highs. With little change in the major index ETFs, short-term trends remain up with key supports unchanged. SPY has been zigzagging higher since the second week of April and key support remains at 138. RSI support remains at 40. I am setting resistance for the 5-day EMA of StochRSI at .75. A move above this level would signal a resumption higher after the short pullback. Be careful out there though. Today we have initial jobless claims and the Challenger jobs report. These two carry more weight than ADP and could trigger a sizable move ahead of Friday's employment report.
**************************************************************************
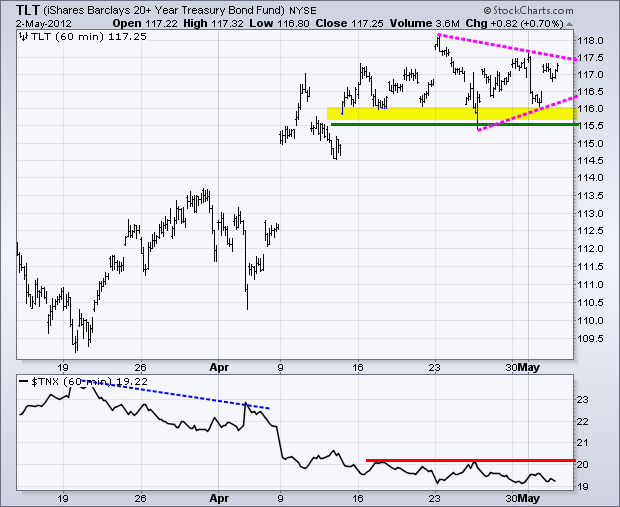
The noose is tightening for the 20+ Year T-Bond ETF (TLT) as the consolidation narrows. I think we will see a break today after the jobless claims and the Challenger report. While this breakout could be reversed after non-farm payrolls on Friday, my best guess is that today will set the tone for the next few weeks. A break above triangle resistance keeps the uptrend alive and signals a continuation higher. This would be bearish for stocks. A support break at 115.50 would be bearish for treasuries and bullish for stocks.
**************************************************************************
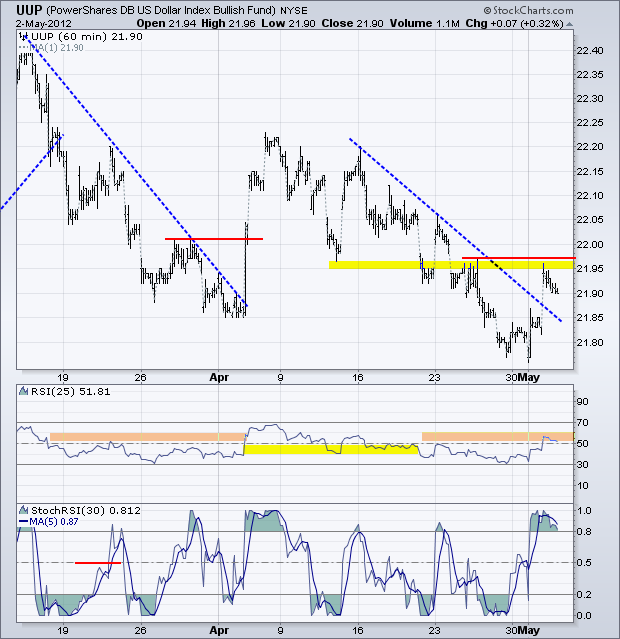
The US Dollar Fund (UUP) made a move on Wednesday with a trendline break and surge above 21.90. After Friday's employment report, the US news cycle will peak and attention may turn to Europe. Note that the European Central Bank (ECB) makes its policy statement today. More emphasis on growth (aka easy money) would be bearish for the Euro. Also note that Greece and France go to the polls on Sunday with the incumbents poised for a setback. On the price chart, a break above key resistance and RSI resistance would be short-term bullish for the greenback.
**************************************************************************
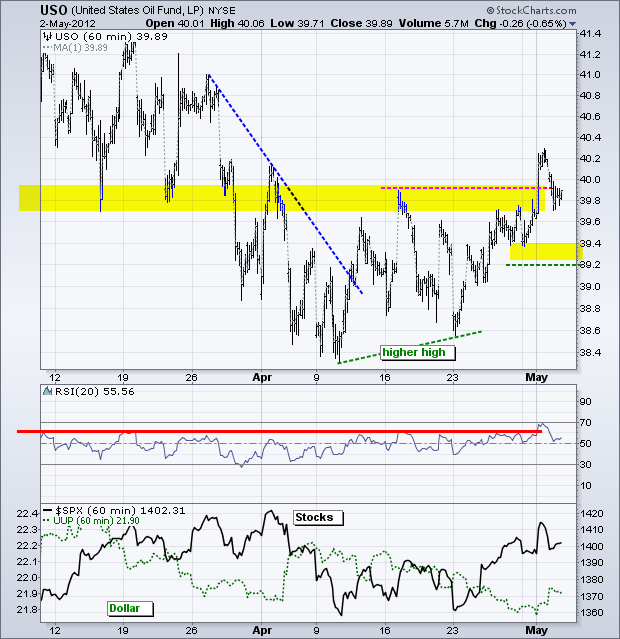
One day after its breakout, the US Oil Fund (USO) got cold feet and pulled back below 40. The short-term trend remains up with a zigzag higher. I am keeping key support at 39.2, a break of which would negate this breakout and reverse the short-term uptrend. Watch the Dollar and the stock market. Strength in the Dollar and weakness in the stock market would provide a double bearish whammy for oil. Conversely, weakness in the Dollar and strength in the stock market would be bullish.
**************************************************************************
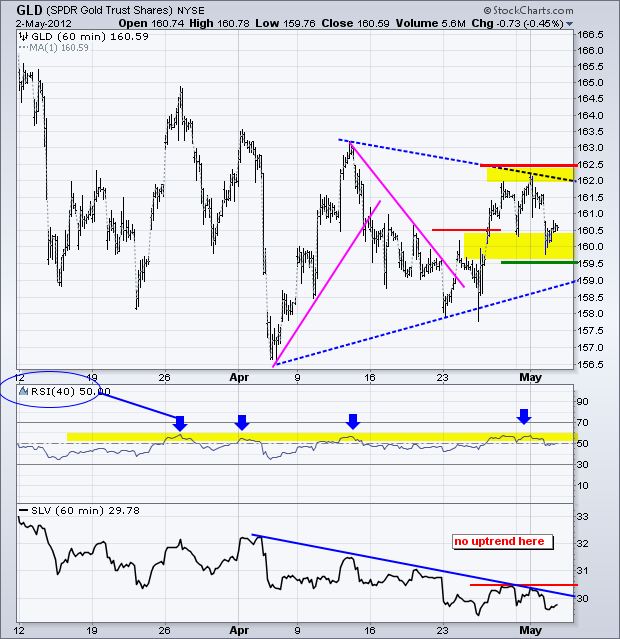
The Gold SPDR (GLD) formed a lower high with the peak around 162 and a triangle is taking shape. The swing within this trend remains up, but barely. A break below 159.5 would reverse this upswing and call for a continuation lower. I would then target a move below the early April low. Notice that RSI has yet to break the 50-60 resistance zone and momentum remains bearish overall. Gold will probably cue off the Dollar. A surge in the Dollar would be negative for gold, while a decline would be positive.
**************************************************************************
Key Economic Reports:
Thu - May 03 - 07:30 - Challenger Job Cuts Report
Thu - May 03 - 08:30 - Initial Jobless Claims
Thu - May 03 - 08:30 – European Central Bank Statement
Thu - May 03 - 10:00 - ISM Services Index
Fri - May 04 - 08:30 - Employment Report
Charts of Interest: Tuesday and Thursday in separate post.
This commentary and charts-of-interest are designed to stimulate thinking. This analysis is not a recommendation to buy, sell, hold or sell short any security (stock ETF or otherwise). We all need to think for ourselves when it comes to trading our own accounts. First, it is the only way to really learn. Second, we are the only ones responsible for our decisions. Think of these charts as food for further analysis. Before making a trade, it is important to have a plan. Plan the trade and trade the plan. Among other things, this includes setting a trigger level, a target area and a stop-loss level. It is also important to plan for three possible price movements: advance, decline or sideways. Have a plan for all three scenarios BEFORE making the trade. Consider possible holding times. And finally, look at overall market conditions and sector/industry performance.

