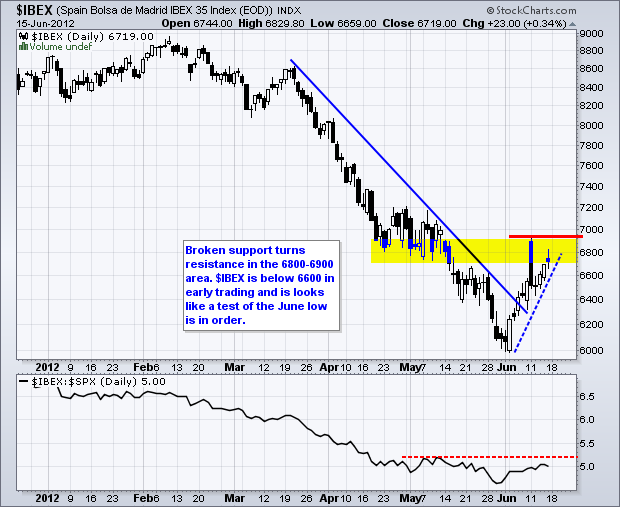
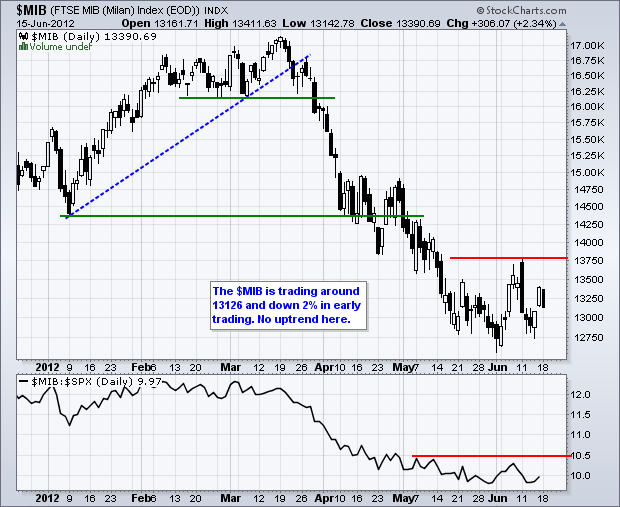
And the results are in! Pro-bailout party New Democracy won the Greek election with around 30% of the vote. They will now have three days to form a coalition with a parliamentary majority. Now comes the tough stuff. The new government will need to renegotiate the austerity package, pass this new package and get another bailout to meet obligations due in mid July. The election was just the first hurdle and there are still many mountains to cross – now only in Greece. Perhaps this is why the market's response is relatively muted today. In early trading on Monday (6AM ET), Asian indices were up around 1%, the European indices were mixed and S&P 500 futures were down slightly. Despite the Greek results, Spanish bond yields moved above 7% on Monday, Spanish stocks were down almost 2% and Italian stocks were down over 1% in early trading. Spain is still the 800 pound gorilla in this EU room.
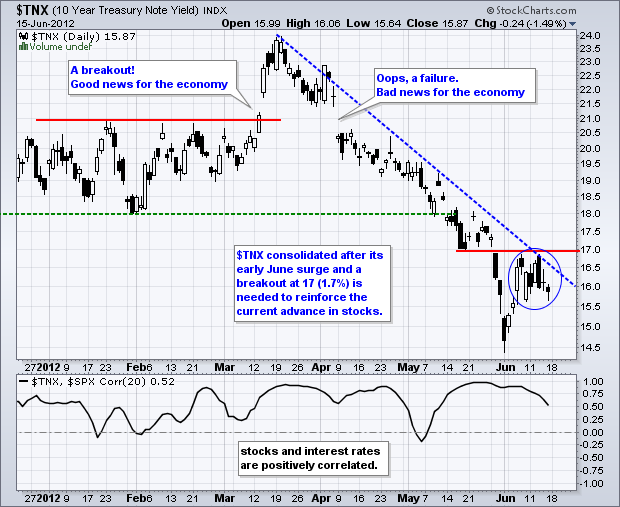
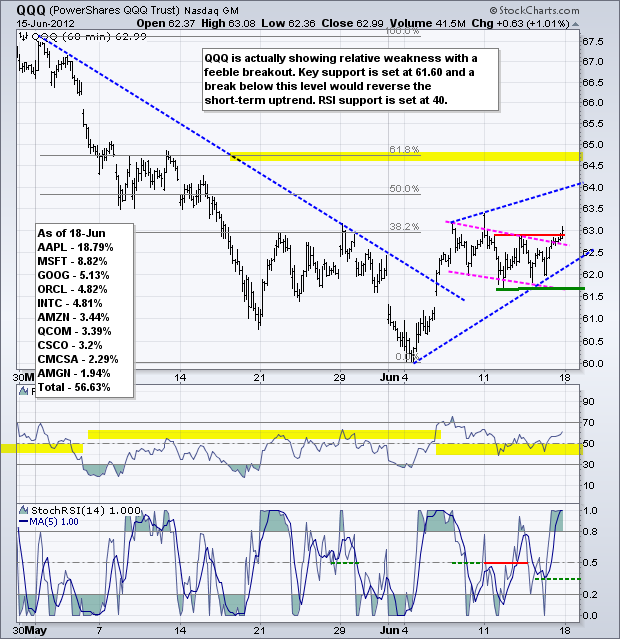
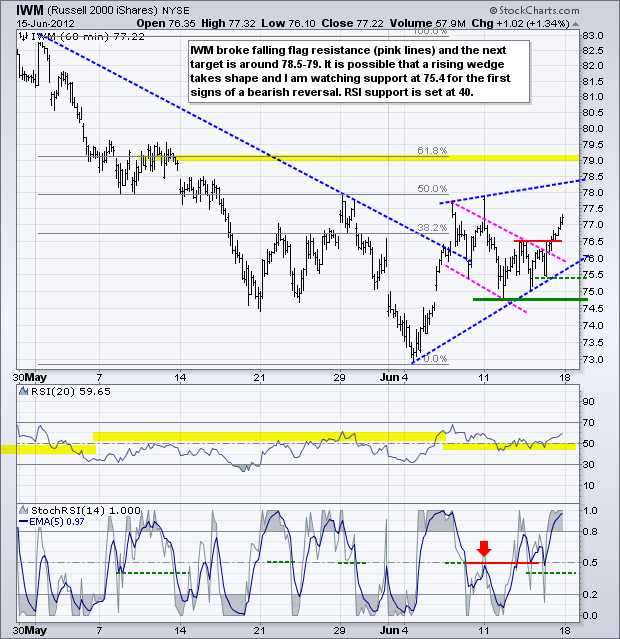
US investors and traders will turn their attention to the Fed and the US economy this week. Truth be told, the Greek elections and EU predicament are just a sideshow (Bob). The real economic events reside in the US. On the whole, economic reports have been below expectations for over two months and last week was no exception. Retail sales fell slightly in May and prior months were revised down. This report is perhaps the most damaging of all because retail sales drive some 2/3 of GDP. Industrial production was also down in May and consumer sentiment fell to its lowest reading in six months. These data points have the US market on edge as the Fed meets on Tuesday-Wednesday. The market expects some sort of quantitative easing and would likely be disappointed if the Fed fails to deliver. Regardless of the Fed, we can expect another volatile week and the chances of whipsaw remain above average.
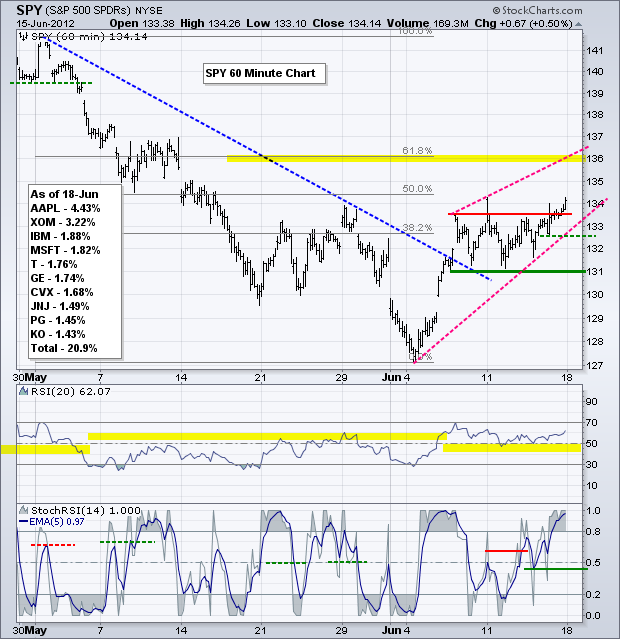
On the 60-minute chart, the S&P 500 ETF (SPY) broke consolidation resistance with a close above 134 on Friday. The breakout signals a continuation of the early June advance and the upside target is around 136. The pink trendlines show a potential rising wedge taking shape and the upper trendline extends above 136 this week. The resistance break, wedge trendline and Friday low mark the first support zone in the 133 area. A strong breakout should hold. A move back below 132.5 would break Friday's low and the wedge trendline. Such a move would question bullish resolve. Key support is set at 131 for now. RSI remains in bull mode as it bounced off the 40-50 support zone. A move below 40 would turn momentum bullish. The 5-day EMA of StochRSI is considered bullish as long as it holds above .40.
**************************************************************************
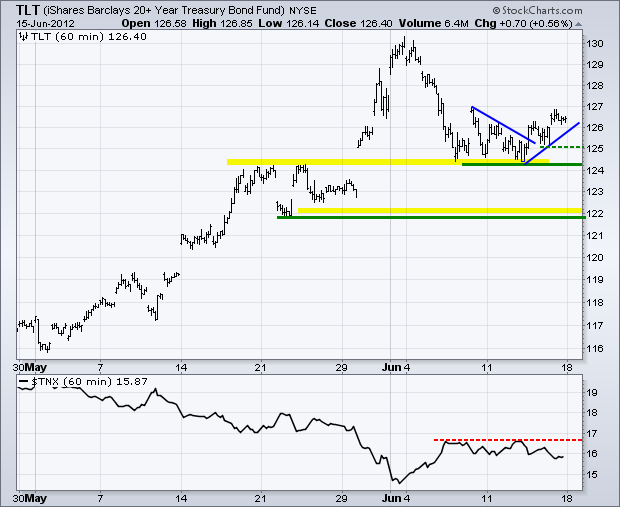
US stocks advanced on Thursday-Friday, while Greek and EU stocks also moved higher late in the week and the EU got a nice bounce. Given this risk-off action in equities, one would expect treasuries to decline at the end of the week. But they didn't. TLT held support in the 124 area and edged above 126 on Friday. Treasuries are focusing on the US economy and perhaps the rise in Spanish bond yields.
**************************************************************************
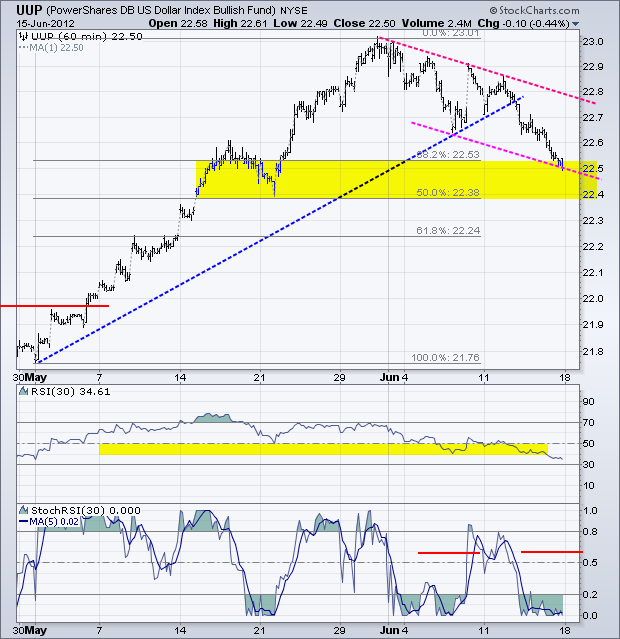
The Euro is flat in early trading and the US Dollar Fund (UUP) is trading in the upper part of its support zone. The mid May dip and 38-50% retracements mark support in the 22.4-22.5 area. Also notice that UUP formed a falling flag the last two weeks. A surge above 22.60 would signal a short-term low and upswing within this flag. A break above the flag trendline would signal a continuation of the May advance. Look for the 5-day EMA of StochRSI to break .60 for a bullish momentum signal.
**************************************************************************
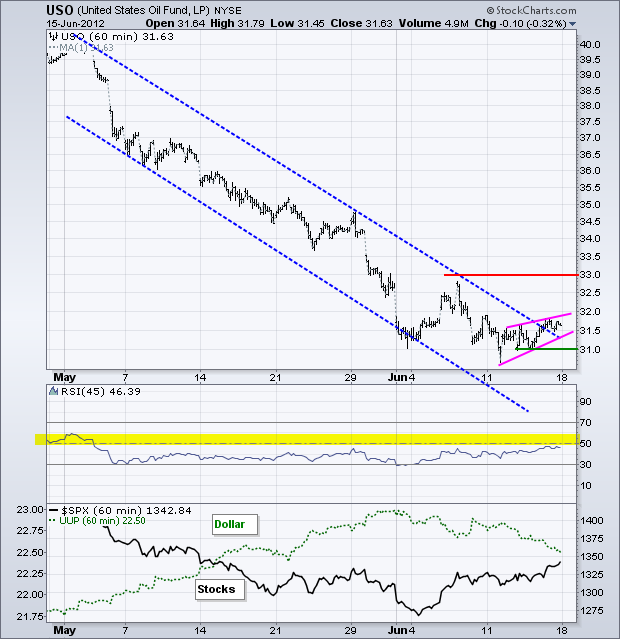
The Dollar retreated last week and stocks moved higher. Oil also moved higher, but the move was relatively weak as the US Oil Fund (USO) barely broke the channel trendline. It is possible that a bearish wedge is taking shape and a break below 31 would signal a continuation lower. Any hints of quantitative easing would be bullish for oil. No mention of quantitative easing would be negative.
**************************************************************************
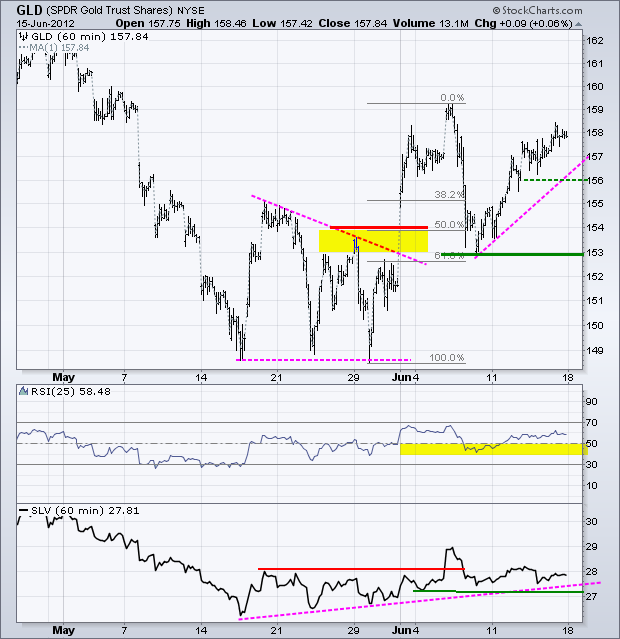
The Gold SPDR (GLD) moved higher last week and is challenging its early June high. At this point, gold seems to benefit from the risk-on trade. Strength in oil, the Euro and stock market benefit gold. A return to the risk-off trade would be negative for bullion. I am marking first support at 156. A break below this level would argue for another test of key support at 153.
**************************************************************************
Key Reports and Events:
Mon - Jun 18 - 10:00 – G20 Summit in Mexico
Mon - Jun 18 - 10:00 - NAHB Housing Market Index
Tue - Jun 19 - 08:30 - Housing Starts/Building Permits
Wed - Jun 20 - 17:00 – Greek Coalition Formation Deadline
Wed - Jun 20 - 07:00 - MBA Mortgage Index
Wed - Jun 20 - 10:30 - Oil Inventories
Wed - Jun 20 - 12:30 – FOMC Policy Statement
Thu - Jun 21 - 08:30 - Initial Claims
Thu - Jun 21 - 10:00 - Existing Home Sales
Thu - Jun 21 - 10:00 - Philadelphia Fed
Thu - Jun 21 - 10:00 - Leading Economic Indicators
Thu - Jun 21 - 10:00 – Amount for Spanish Bailout Request
Sun - Jun 28 - 10:00 – 2-day EU Summit
Charts of Interest: Tuesday and Thursday
This commentary and charts-of-interest are designed to stimulate thinking. This analysis is not a recommendation to buy, sell, hold or sell short any security (stock ETF or otherwise). We all need to think for ourselves when it comes to trading our own accounts. First, it is the only way to really learn. Second, we are the only ones responsible for our decisions. Think of these charts as food for further analysis. Before making a trade, it is important to have a plan. Plan the trade and trade the plan. Among other things, this includes setting a trigger level, a target area and a stop-loss level. It is also important to plan for three possible price movements: advance, decline or sideways. Have a plan for all three scenarios BEFORE making the trade. Consider possible holding times. And finally, look at overall market conditions and sector/industry performance.
