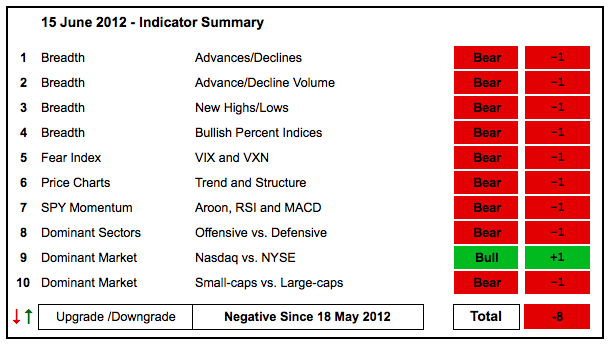
After a rebound last week, stocks turned flat this week and treaded water ahead of the Greek elections. The AD Volume Lines established minor resistance levels with the late May highs and breakouts would be short-term bullish. However, this would not be enough to turn medium-term bullish again. Also note that the major index ETFs remain below their late May highs and have yet to reclaim broken support. Depending on market reaction to Greece and the Fed policy statement (Wed), we could see some breakouts next week. Let's see them first and judge breadth before rushing to any conclusions.
- AD Lines: Bearish. The Nasdaq AD Line broke to a new 52-week low in early June and remains in a downtrend overall. The NYSE AD Line broke support from the March-April lows and this support zone turned into resistance.
- AD Volume Lines: Bearish. The NYSE and Nasdaq AD Volume Lines broke neckline support of head-and-shoulders patterns in May and became oversold at the beginning of June. An oversold bounce is possible, but much more is required to negate the May support breaks.
- Net New Highs: Bearish. Nasdaq Net New Highs turned negative again and the cumulative line remains below its 10-day EMA. NYSE Net New Highs edged into positive territory and the cumulative line edged above its 10-day EMA. Overall, NYSE Net New Highs are more flat than up and I will not turn bullish on this indicator just yet.
- Bullish Percent Indices: Bearish. Five of the nine BPIs remain below 50%. The finance, healthcare, consumer staples and utilities BPIs are above 50%.
- VIX/VXN: Bearish. The S&P 500 Volatility Index ($VIX) and the Nasdaq 100 Volatility Index ($VXN) pulled back to broken resistance from the February-April highs. This level becomes support and the May breakouts are still holding.
- Trend-Structure: Bearish. DIA, IWM, MDY and SPY all broke support levels in May and these support breaks turn into resistance. At the very least, a move back above broken support is needed to negate the May breakdowns.
- SPY Momentum: Bearish. RSI and MACD(5,35,5) rebounded sharply as SPY got an oversold bounce, but RSI has yet to break 60 and MACD remains in negative territory. Also note that the Aroon Oscillator is still below -50 and needs to clear +50 for a bullish signal.
- Offensive Sector Performance: Bearish. XLF, XLK, XLY and XLI remain below their late May highs, while XLP, XLU and XLV are above these highs. XLP and XLU hit new 52-week highs recently and remain the two strongest sectors overall.
- Nasdaq Performance: Bullish. The $COMPQ:$NYA turned flat the last two months, but is holding its gains and above support from the April low. The Nasdaq is still stronger than the NY Composite ($NYA) overall.
- Small-cap Performance: Bearish. The $RUT:$OEX ratio peaked in early February and moved to a new 2012 low this week. Relative weakness in small-caps is bearish for the market overall.
- Breadth Charts (here) and Inter-market charts (here) have been updated.
This table is designed to offer an objective look at current market conditions. It does not aim to pick tops or bottoms. Instead, it seeks to identify noticeable shifts in buying and selling pressure. With 10 indicator groups, the medium-term evidence is unlikely to change drastically overnight.
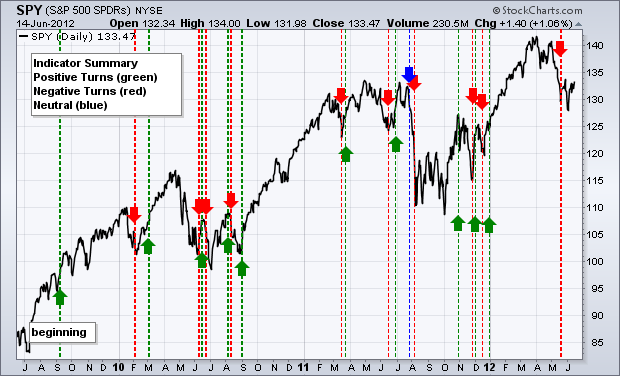
Previous turns include:
Negative on 18-May-11
Positive on 30-December-11
Negative on 16-December-11
Positive on 3-December-11
Negative on 23-November-11
Positive on 28-October-11
Negative on 5-August-11
Neutral on 29-Jul-11
Positive on 30-Jun-11
Negative on 17-Jun-11
Positive on 25-Mar-11
Negative on 18-Mar-11
Positive on 3-Sep-10
Negative on 13-Aug-10
Positive on 6-Aug-10
Negative on 24-Jun-10
Positive on 18-Jun-10
Negative on 11-Jun-10
Positive on 5-March-10
Negative on 5-Feb-10
Positive on 11-Sept-09


