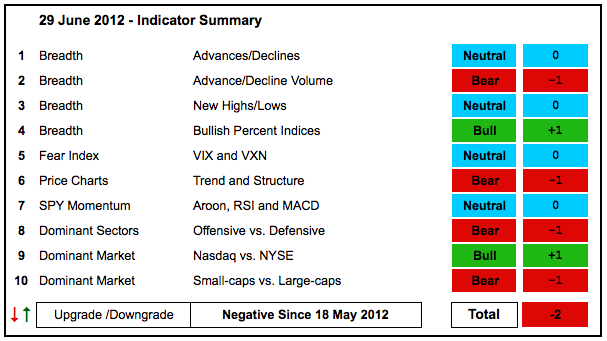
The June run is set to continue with stock futures up sharply on Friday. Continued strength means the indicator summary is improving. Note that the NYSE AD Line and NYSE Net New Highs are bullish. The Bullish Percent Indices are bullish on the whole and the volatility indices fell sharply in June. This still looks like a counter trend rally within a bigger downtrend, but the advance is testing the limits of this downtrend.
- AD Lines: Neutral. The Nasdaq AD Line is in a medium-term downtrend since March, but a short-term uptrend since early June. The NYSE AD Line is showing some serious resilience with a strong surge in June and challenge to the March-April highs.
- AD Volume Lines: Bearish. The NYSE and Nasdaq AD Volume Lines peaked in March and broke down in May. Both are in short-term uptrends since early June, but the advance is not enough to undo the May breakdowns.
- Net New Highs: Neutral. Nasdaq Net New Highs have been mixed since early June. NYSE Net New Highs have been mostly positive in June and the Cumulative Net New Highs Line is challenging its May high. This indicator is bullish.
- Bullish Percent Indices: Bullish. Five of the nine BPIs are above 50% and the Materials BPI ($BPMATE) is at 50%. The cup is half full according to these Point & Figure indicators.
- VIX/VXN: Neutral. The S&P 500 Volatility Index ($VIX) and the Nasdaq 100 Volatility Index ($VXN) have been trending down since June. Even though this could be a correction within a bigger uptrend, the fear factor is clearly improving as long as these two fall.
- Trend-Structure: Bearish. DIA, IWM, MDY, QQQ and SPY rallied in June and remain in uptrends the last four weeks, but I still think these Major Index ETFs are still in downtrends the last four months.
- SPY Momentum: Neutral. RSI remains below resistance at 60 and MACD (5,35,5) is just below the zero line. These two are bearish, but the Aroon Oscillator surged above +50 and remains above +50, which is bullish.
- Offensive Sector Performance: Bearish. The defensive sectors are still stronger than the offensive sectors. However, XLY, XLK and XLF are showing some resilience by holding the support from the second week of June.
- Nasdaq Performance: Bullish. The $COMPQ:$NYA has been flat since late March, but is holding its gains and remains above support from the April low.
- Small-cap Performance: Bearish. The $RUT:$OEX ratio surged the last two weeks, but remains in a downtrend since early February. Follow through and a breakout are needed to turn this indicator bullish.
- Breadth Charts (here) and Inter-market charts (here) have been updated.
This table is designed to offer an objective look at current market conditions. It does not aim to pick tops or bottoms. Instead, it seeks to identify noticeable shifts in buying and selling pressure. With 10 indicator groups, the medium-term evidence is unlikely to change drastically overnight.
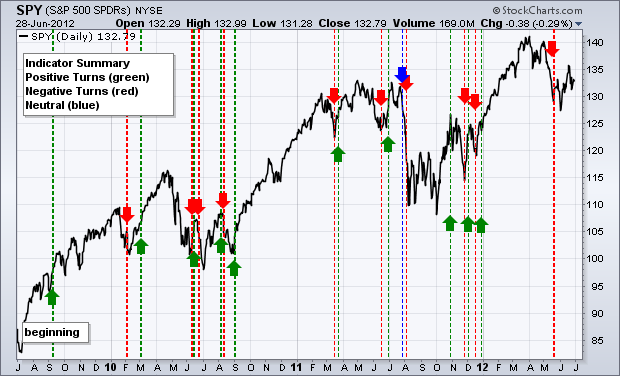
Previous turns include:
Negative on 18-May-11
Positive on 30-December-11
Negative on 16-December-11
Positive on 3-December-11
Negative on 23-November-11
Positive on 28-October-11
Negative on 5-August-11
Neutral on 29-Jul-11
Positive on 30-Jun-11
Negative on 17-Jun-11
Positive on 25-Mar-11
Negative on 18-Mar-11
Positive on 3-Sep-10
Negative on 13-Aug-10
Positive on 6-Aug-10
Negative on 24-Jun-10
Positive on 18-Jun-10
Negative on 11-Jun-10
Positive on 5-March-10
Negative on 5-Feb-10
Positive on 11-Sept-09


