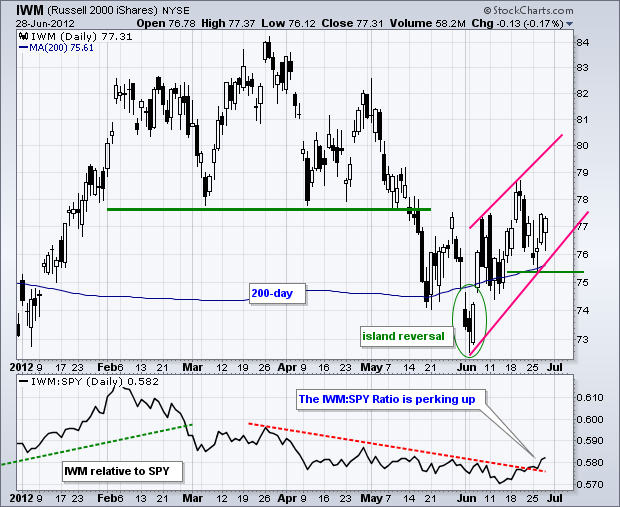
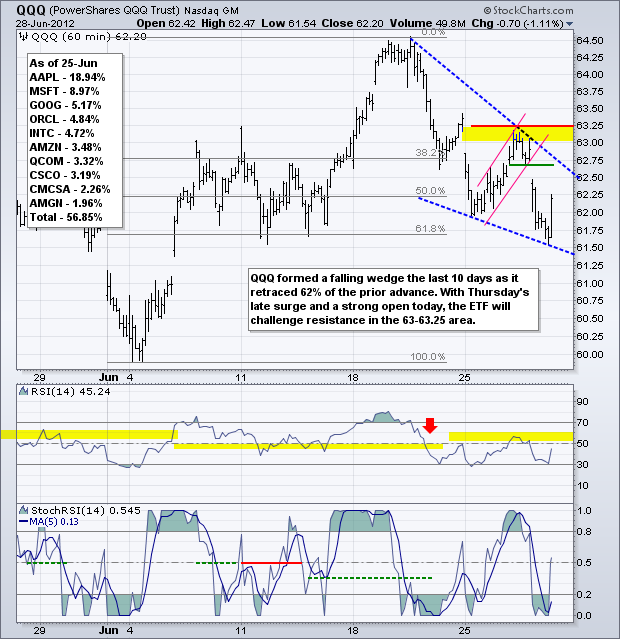
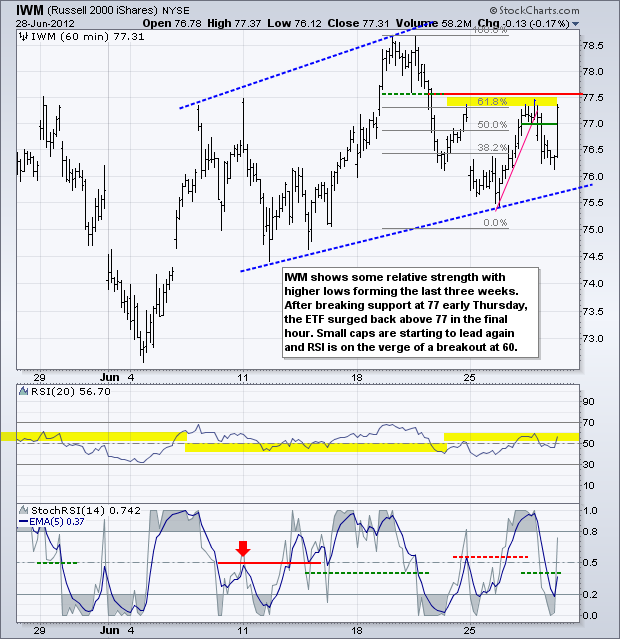
Stocks ended mixed on Thursday as sharp rallies in the final hour paired losses significantly. The Nasdaq 100 ETF (QQQ) still lost over 1%, but the S&P Midcap SPDR (MDY) closed up .30% on the day. The nine sector SPDRs were mixed with four up and five down. With a strong open expected today, stocks will attempt to extend the bounce that started with the early June reversal. The Russell 2000 ETF (IWM) can be seen zigzagging higher this month with a series of rising peaks and rising troughs. Key support is set at this week's low, which is also near the 200-day moving average.
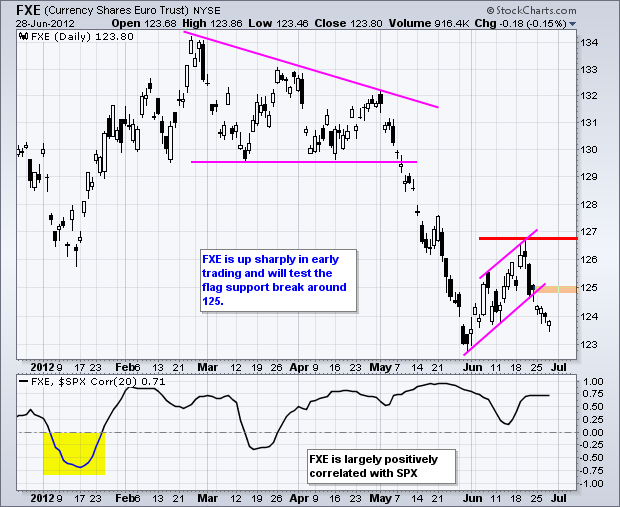
The bulls are getting a big lift today after the EU leaders acted to shore up the banking system. In short, EU leaders agreed to form a single regulator for Eurozone banks, provide aid for Spanish banks and support the bond markets in Spain and Italy. The EU has decided to move towards a banking union with another grand announcement but implementation is still a long ways away. Nevertheless, shares in Asia and Europe are sharply higher, while Dow futures are up over 100 points. The Euro, gold and oil are also up sharply, while treasuries and the Dollar are down. Even though big moves are expected on the open, what happens after the open is more important. We have seen EU induced moves fail twice before. Follow through is what separates the contenders (real moves) from the pretenders (head fakes).
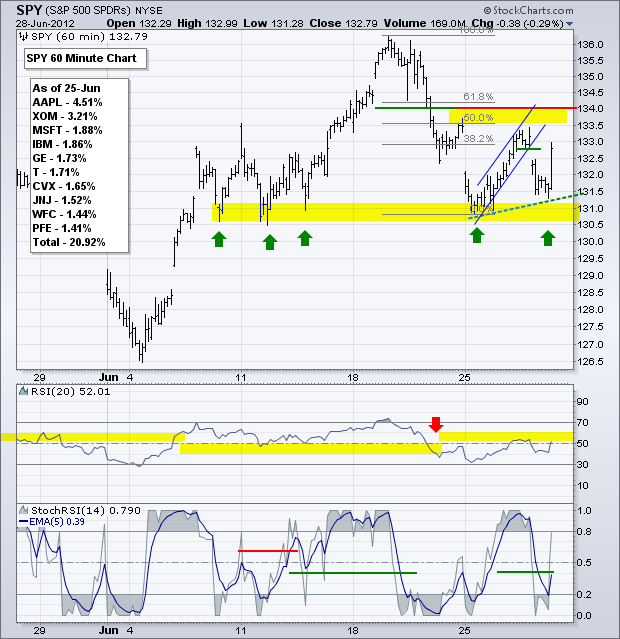
SPY broke rising flag support with a gap down and continued lower, but a late charge in the final hour pushed the index back above 132.50. With an open expected in the 133.5 area, the ETF will test resistance today. One thing is for sure: there is clearly a bull market in volatility. At this point, SPY has held support in the 131 area at least five times this month. In addition, the ETF formed a higher low this week and is poised to break above this week's high. This rally could continue into early next week and then slow as we near Friday's employment report. RSI formed a higher low and could break above 60 to turn momentum bullish today.
**************************************************************************
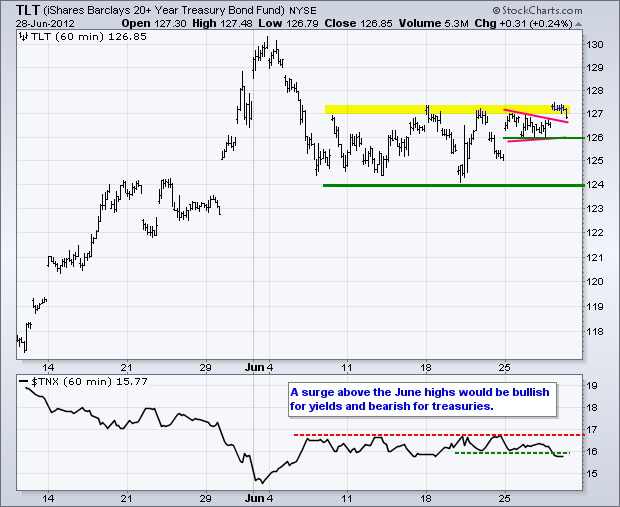
Treasuries are down in early trading as the world moves to risk-on. This means safe havens, such as the Dollar, are sold to buy riskier assets, such as stocks. The 20+ Year T-Bond ETF (TLT) broke pennant resistance, but did not clear resistance from the June highs. With a sharp move lower expected today, the ETF could break first support at 126 and head towards key support at 124.
**************************************************************************
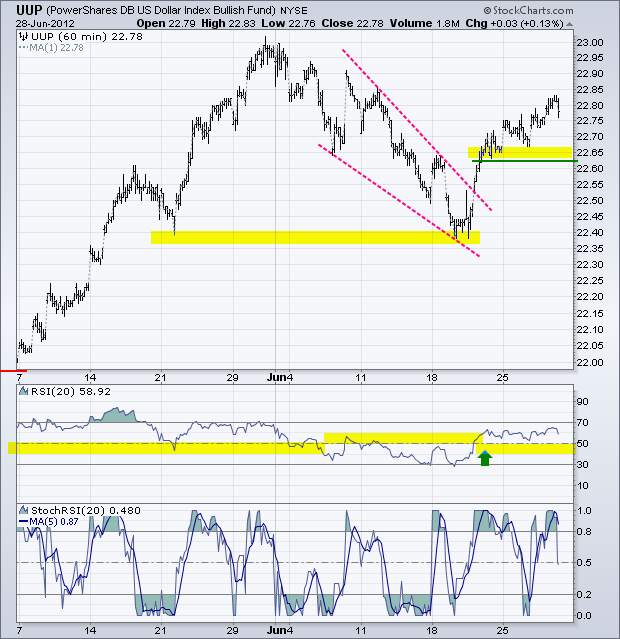
The short squeeze is on for the Euro and the Dollar is under pressure. With weakness expected today, the Dollar Bullish ETF (UUP) will stop short of its late May high and form a lower high. What happens after the open holds the key. Follow through below first support would be short-term bearish, as would an RSI break below 40.
**************************************************************************
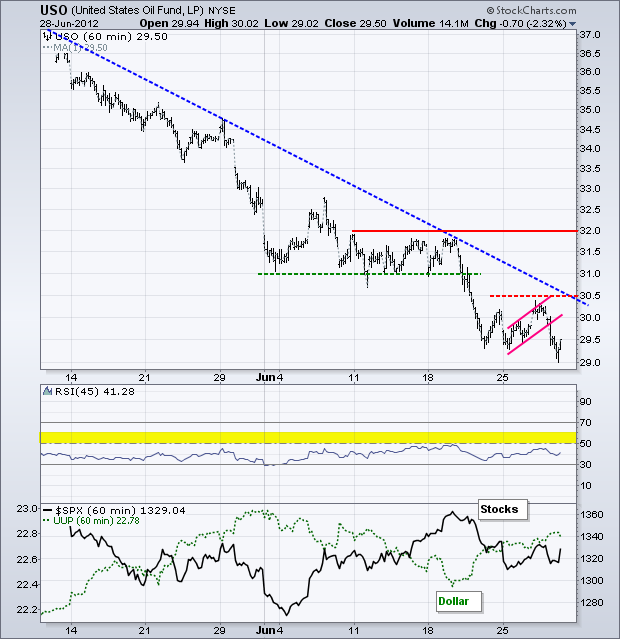
The US Oil Fund (USO) broke flag support, but this break will be challenged with a strong open on Friday. Follow through above 30.5 would be short-term bullish for oil and could pave the way for a move to the prior consolidation zone (31-32).
**************************************************************************
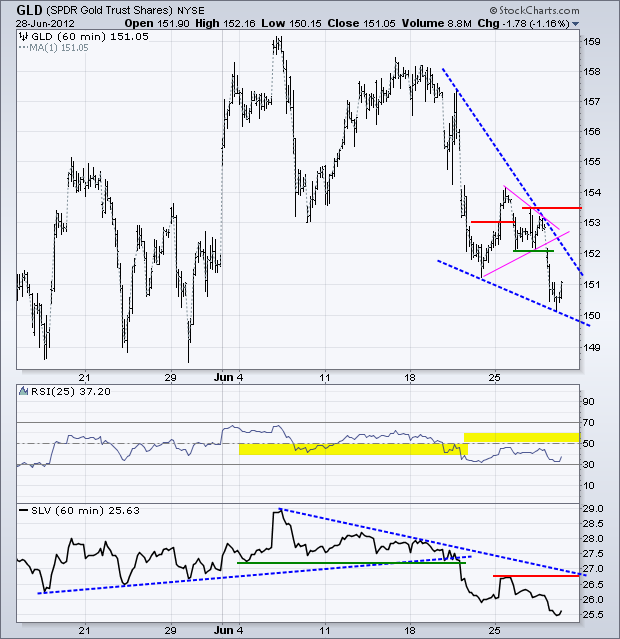
Gold is part of the risk-on trade, which means it will benefit from strength in stocks and the Euro. Of course, gold is also negatively correlated with the Dollar. The Gold SDPR (GLD) broke pennant support and moved below 151. The trend is down as a falling wedge takes shape. A surge above the upper trendline would provide the first bullish signal. Follow through above resistance at 153.50 would complete the trend reversal.
**************************************************************************
Key Reports and Events:
Fri - Jun 29 - 08:30 - Personal Income & Spending
Fri - Jun 29 - 09:45 - Chicago Purchasing Managers Index (PMI)
Fri - Jun 29 - 09:55 - Michigan Sentiment
Fri - Jun 29 - 12:00 – 2-day EU Summit Ends
Thu - Jul 05 - 10:00 – European Central Bank Policy Statement
Charts of Interest: Tuesday and Thursday
This commentary and charts-of-interest are designed to stimulate thinking. This analysis is not a recommendation to buy, sell, hold or sell short any security (stock ETF or otherwise). We all need to think for ourselves when it comes to trading our own accounts. First, it is the only way to really learn. Second, we are the only ones responsible for our decisions. Think of these charts as food for further analysis. Before making a trade, it is important to have a plan. Plan the trade and trade the plan. Among other things, this includes setting a trigger level, a target area and a stop-loss level. It is also important to plan for three possible price movements: advance, decline or sideways. Have a plan for all three scenarios BEFORE making the trade. Consider possible holding times. And finally, look at overall market conditions and sector/industry performance.

About the author:
Arthur Hill, CMT, is the Chief Technical Strategist at TrendInvestorPro.com. Focusing predominantly on US equities and ETFs, his systematic approach of identifying trend, finding signals within the trend, and setting key price levels has made him an esteemed market technician. Arthur has written articles for numerous financial publications including Barrons and Stocks & Commodities Magazine. In addition to his Chartered Market Technician (CMT) designation, he holds an MBA from the Cass Business School at City University in London.
Learn More
