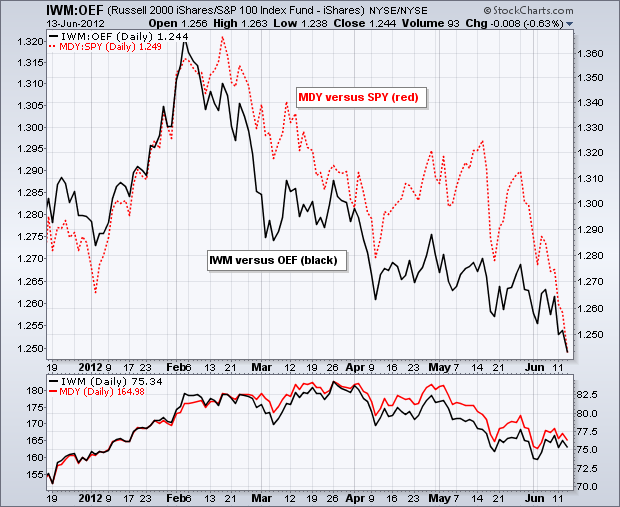
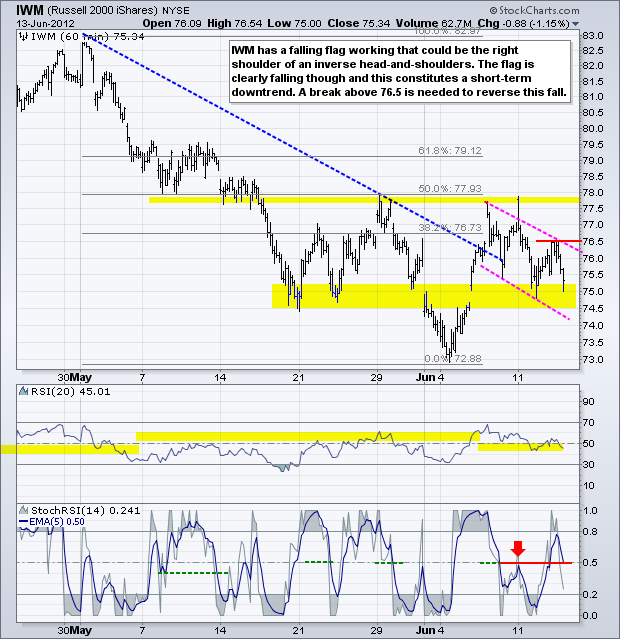
Stocks moved higher in the first half of the day and then lower in the second half. With the afternoon decline outpacing the morning advance, the major index ETFs closed modestly lower. Mid-caps led the decline with the S&P MidCap 400 SPDR (MDY) losing 1.34%. Small-caps were not far behind with the Russell 2000 ETF (IWM) losing over 1%. Relative weakness in small and mid caps is not a good sign for the market overall or the domestic economy. The chart below shows the MDY:SPY ratio (red) moving to a new 2012 low with a plunge since late May. The IWM:OEF ratio (black) peaked in early February and hit a new 2012 low this week as well.
Eight of the nine sectors were down with the Basic Materials SPDR (XLB), the Energy SPDR (XLE) and the Consumer Discretionary SPDR (XLY) posting the biggest losses. Continued weakness in commodity prices is weighing on these two sectors. The Utilities SPDR (XLU) was the lone gainer as investors continued pursuing dividends.
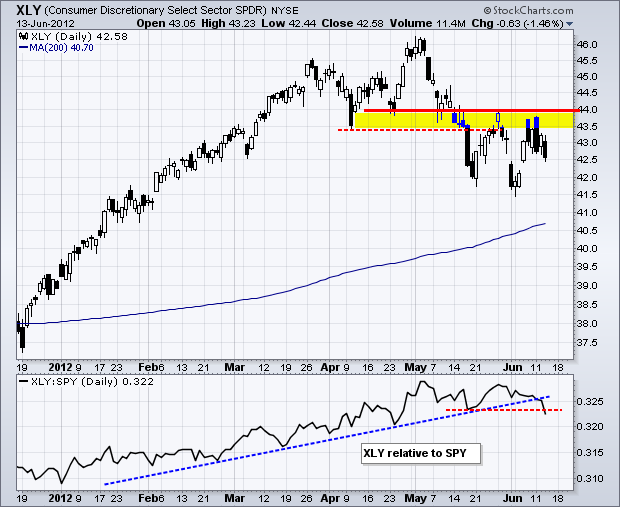
A mixed retail sales report weighed on retailers, which in turn negatively affected the consumer discretionary sector. XLY is another good proxy for the domestic economy and for the stock market overall. XLY is failing at resistance for the second time and the Price Relative broke below its mid May low. This key sector SPDR is suddenly showing relative weakness and this is negative for the market overall.
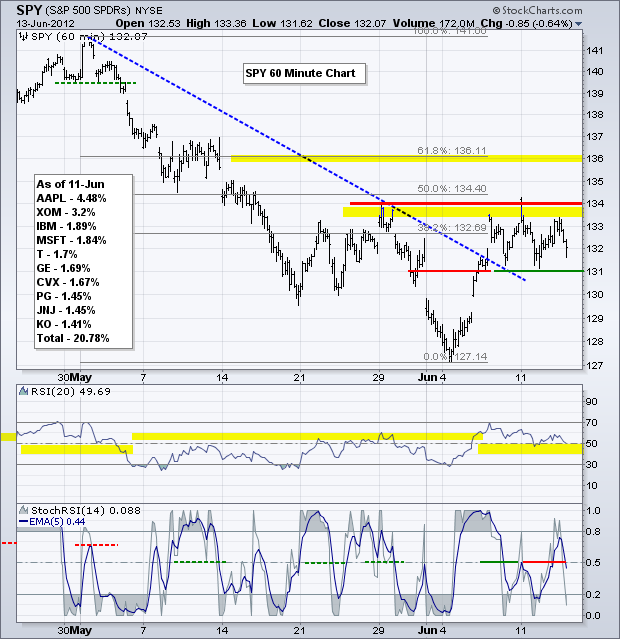
On the 60-minute chart, the S&P 500 ETF (SPY) remains stuck in a trading range since late last week. The ETF surged above 131, hit resistance at 134 and found support back at 131 with two bounces. This could be a flat flag and a break above 133.50 would signal a continuation higher. A break below support at 131 would suggest a failure at resistance and argue for a test of the June low. RSI moved above 60 last week and held the 40-50 zone so far this week. A break below 40 would turn RSI bearish again. The 5-period EMA of StochRSI moved above .50, but failed to exceed .80 and turned lower. This looks like a failed signal.
**************************************************************************
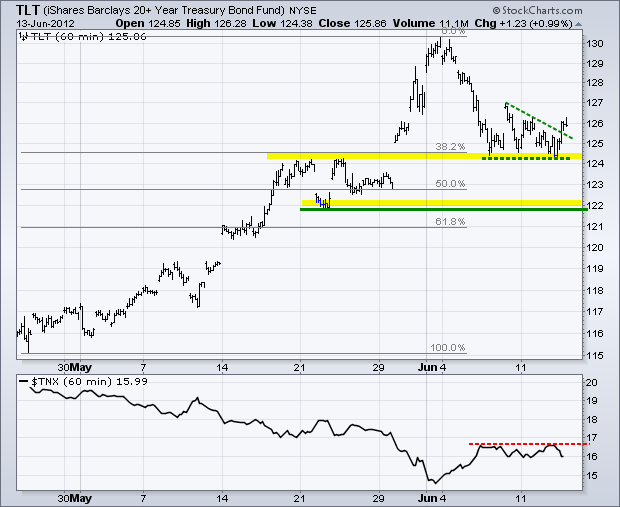
The 20+ Year T-Bond ETF (TLT) bounced off support and broke the descending triangle trendline. This is due to weakness in the stock market and the mixed retail sales report. First support remains at 124 and key support is set just below 122.
**************************************************************************
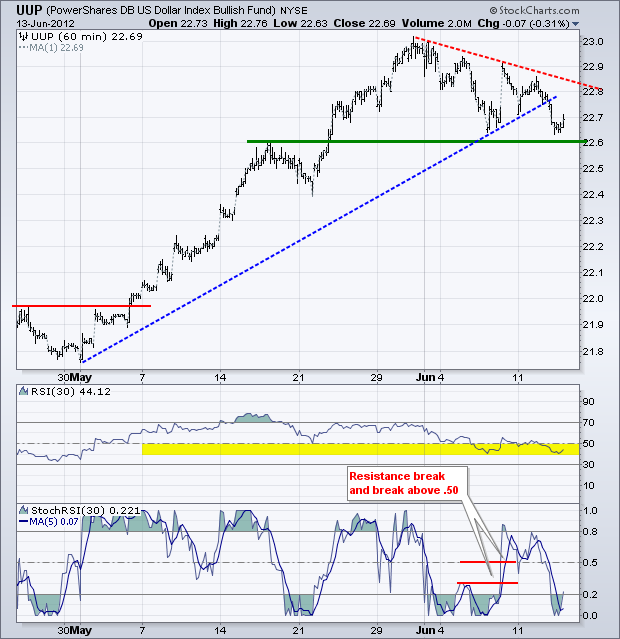
The US Dollar Fund (UUP) remains in an uptrend overall, but a correction is currently underway. UUP peaked around 23 and then worked its way lower the last two weeks. Support is set at 22.60 and a break below this level would argue for a deeper correction. RSI is testing support in the 40-50 zone. The 5-period EMA of StochRSI failed to hold its breakout at .50 and this is another sign of short-term weakness.
**************************************************************************
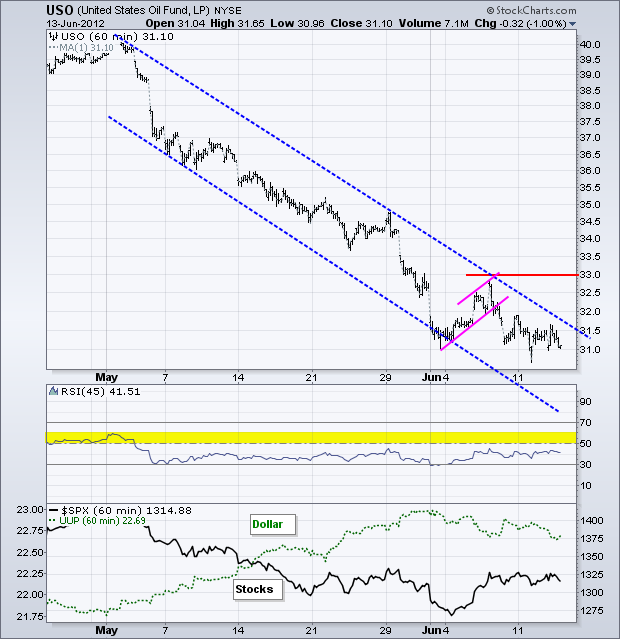
The US Oil Fund (USO) remains under pressure as OPEC ministers meet to decide quotas and adherence to said quotas. USO remains oversold after a 22% decline since early May, but in a steady downtrend with no signs of buying pressure. A channel breakout would provide the first positive sign. A resistance break at 33 and RSI breakout at 60 would fully reverse this downtrend.
**************************************************************************
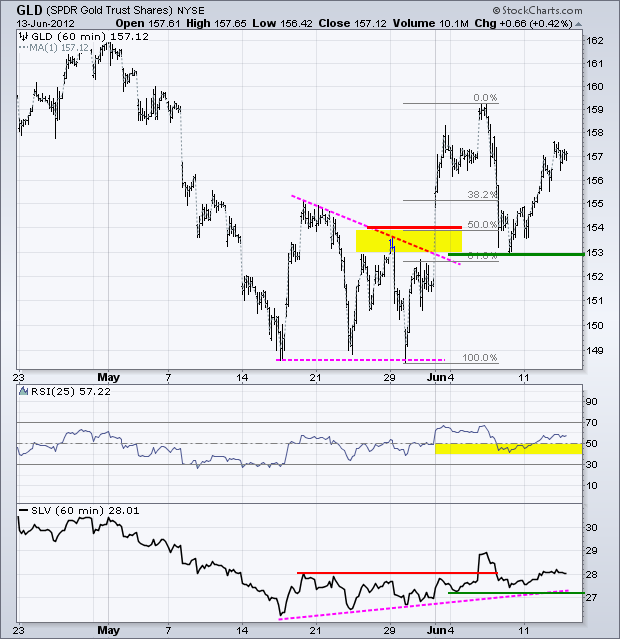
No change. The Gold SPDR (GLD) bounced off support at 153 with a decent surge the last four days. The trend since late May is up and 153 holds the key. I adjusted RSI to 25-periods so it conforms to the current uptrend. Notice how 25-day RSI held the 40-50 zone with last week's decline. This setting puts RSI in harmony with the short-term uptrend in GLD. A break below 40 would turn this momentum indicator bearish.
**************************************************************************
Key Reports and Events:
Wed - Jun 13 - 07:00 - MBA Mortgage Index
Wed - Jun 13 - 08:30 - Retail Sales
Wed - Jun 13 - 08:30 - Producer Price Index (PPI)
Wed - Jun 13 - 10:00 - Business Inventories
Wed - Jun 13 - 10:30 - Oil Inventories
Thu - Jun 14 - 08:30 - Jobless Claims
Thu - Jun 14 - 08:30 - Consumer Price Index (CPI)
Fri - Jun 15 - 08:30 - Empire Manufacturing
Fri - Jun 15 - 09:15 - Industrial Production
Fri - Jun 15 - 09:55 - Michigan Sentiment
Sun - Jun 17 - 10:00 – Greek Elections
Wed - Jun 20 - 12:30 – FOMC Policy Statement
Thu - Jun 21 - 10:00 – Amount for Spanish Bailout Request
Sun - Jun 28 - 10:00 – 2-day EU Summit
Charts of Interest: Tuesday and Thursday
This commentary and charts-of-interest are designed to stimulate thinking. This analysis is not a recommendation to buy, sell, hold or sell short any security (stock ETF or otherwise). We all need to think for ourselves when it comes to trading our own accounts. First, it is the only way to really learn. Second, we are the only ones responsible for our decisions. Think of these charts as food for further analysis. Before making a trade, it is important to have a plan. Plan the trade and trade the plan. Among other things, this includes setting a trigger level, a target area and a stop-loss level. It is also important to plan for three possible price movements: advance, decline or sideways. Have a plan for all three scenarios BEFORE making the trade. Consider possible holding times. And finally, look at overall market conditions and sector/industry performance.
A mixed retail sales report weighed on retailers, which in turn negatively affected the consumer discretionary sector. XLY is another good proxy for the domestic economy and for the stock market overall. XLY is failing at resistance for the second time and the Price Relative broke below its mid May low. This key sector SPDR is suddenly showing relative weakness and this is negative for the market overall.

On the 60-minute chart, the S&P 500 ETF (SPY) remains stuck in a trading range since late last week. The ETF surged above 131, hit resistance at 134 and found support back at 131 with two bounces. This could be a flat flag and a break above 133.50 would signal a continuation higher. A break below support at 131 would suggest a failure at resistance and argue for a test of the June low. RSI moved above 60 last week and held the 40-50 zone so far this week. A break below 40 would turn RSI bearish again. The 5-period EMA of StochRSI moved above .50, but failed to exceed .80 and turned lower. This looks like a failed signal.


**************************************************************************
The 20+ Year T-Bond ETF (TLT) bounced off support and broke the descending triangle trendline. This is due to weakness in the stock market and the mixed retail sales report. First support remains at 124 and key support is set just below 122.

**************************************************************************
The US Dollar Fund (UUP) remains in an uptrend overall, but a correction is currently underway. UUP peaked around 23 and then worked its way lower the last two weeks. Support is set at 22.60 and a break below this level would argue for a deeper correction. RSI is testing support in the 40-50 zone. The 5-period EMA of StochRSI failed to hold its breakout at .50 and this is another sign of short-term weakness.

**************************************************************************
The US Oil Fund (USO) remains under pressure as OPEC ministers meet to decide quotas and adherence to said quotas. USO remains oversold after a 22% decline since early May, but in a steady downtrend with no signs of buying pressure. A channel breakout would provide the first positive sign. A resistance break at 33 and RSI breakout at 60 would fully reverse this downtrend.

**************************************************************************
No change. The Gold SPDR (GLD) bounced off support at 153 with a decent surge the last four days. The trend since late May is up and 153 holds the key. I adjusted RSI to 25-periods so it conforms to the current uptrend. Notice how 25-day RSI held the 40-50 zone with last week's decline. This setting puts RSI in harmony with the short-term uptrend in GLD. A break below 40 would turn this momentum indicator bearish.

**************************************************************************
Key Reports and Events:
Wed - Jun 13 - 07:00 - MBA Mortgage Index
Wed - Jun 13 - 08:30 - Retail Sales
Wed - Jun 13 - 08:30 - Producer Price Index (PPI)
Wed - Jun 13 - 10:00 - Business Inventories
Wed - Jun 13 - 10:30 - Oil Inventories
Thu - Jun 14 - 08:30 - Jobless Claims
Thu - Jun 14 - 08:30 - Consumer Price Index (CPI)
Fri - Jun 15 - 08:30 - Empire Manufacturing
Fri - Jun 15 - 09:15 - Industrial Production
Fri - Jun 15 - 09:55 - Michigan Sentiment
Sun - Jun 17 - 10:00 – Greek Elections
Wed - Jun 20 - 12:30 – FOMC Policy Statement
Thu - Jun 21 - 10:00 – Amount for Spanish Bailout Request
Sun - Jun 28 - 10:00 – 2-day EU Summit
Charts of Interest: Tuesday and Thursday
This commentary and charts-of-interest are designed to stimulate thinking. This analysis is not a recommendation to buy, sell, hold or sell short any security (stock ETF or otherwise). We all need to think for ourselves when it comes to trading our own accounts. First, it is the only way to really learn. Second, we are the only ones responsible for our decisions. Think of these charts as food for further analysis. Before making a trade, it is important to have a plan. Plan the trade and trade the plan. Among other things, this includes setting a trigger level, a target area and a stop-loss level. It is also important to plan for three possible price movements: advance, decline or sideways. Have a plan for all three scenarios BEFORE making the trade. Consider possible holding times. And finally, look at overall market conditions and sector/industry performance.

About the author:
Arthur Hill, CMT, is the Chief Technical Strategist at TrendInvestorPro.com. Focusing predominantly on US equities and ETFs, his systematic approach of identifying trend, finding signals within the trend, and setting key price levels has made him an esteemed market technician. Arthur has written articles for numerous financial publications including Barrons and Stocks & Commodities Magazine. In addition to his Chartered Market Technician (CMT) designation, he holds an MBA from the Cass Business School at City University in London.
Learn More
