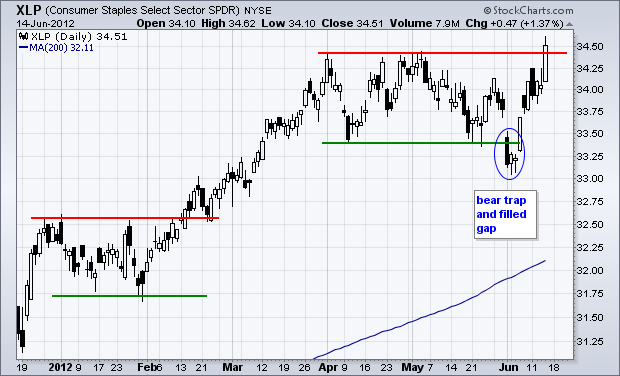
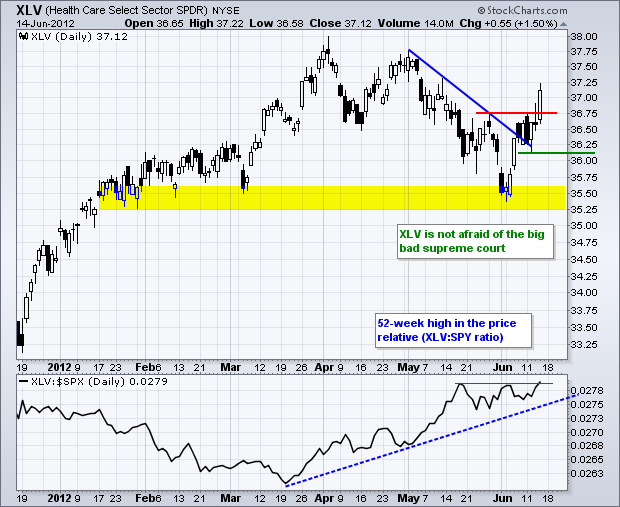
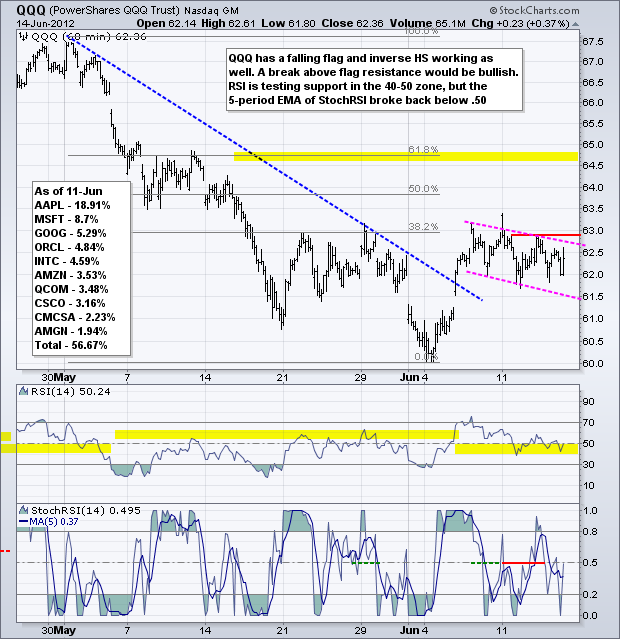
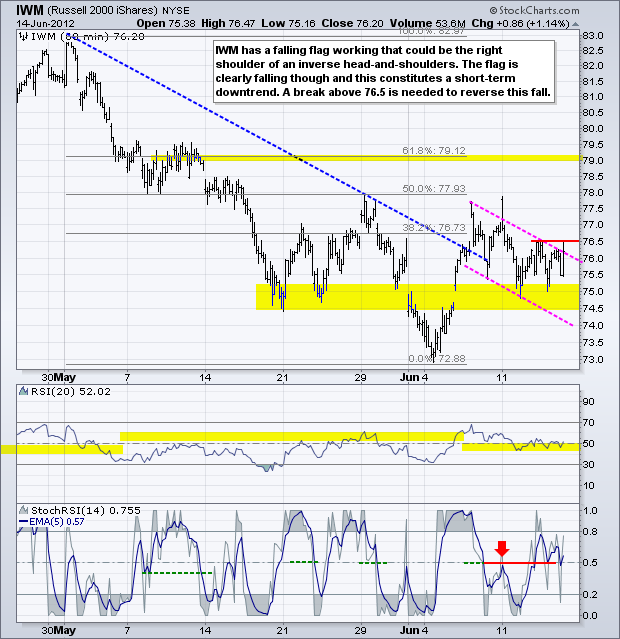
Stocks caught a bid on Thursday with the major index ETFs closing modestly higher. The Dow Industrials SPDR (DIA) led the way with a 1.19% advance. The Nasdaq 100 ETF (QQQ) lagged with a .37% advance. All sectors were up with the Energy SPDR (XLE) and Healthcare SPDR (XLV) leading the way. Also note that the Consumer Discretionary SPDR (XLY) and Consumer Staples SPDR (XLP) were strong with gains exceeding 1.3%. For the week, stocks have pretty much traded flat and most ETFs remain below Monday's open, which was sharply higher because of the Spanish bailout announcement. Overall, the market remains defensive as XLP surged to a new 52-week high and XLV broke above its late May high.
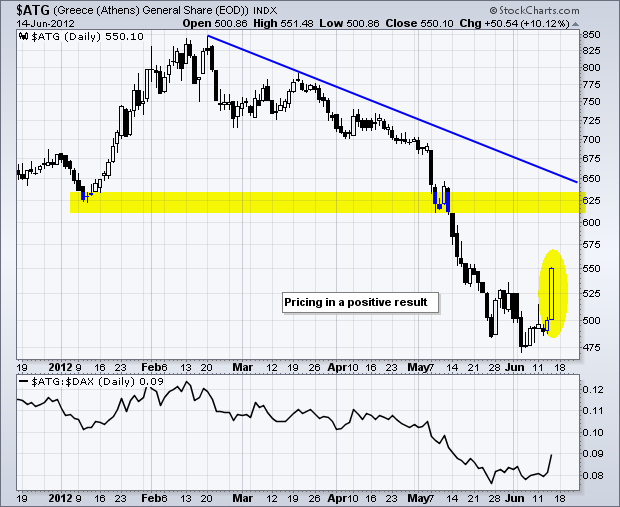
The financial media would have us believe that world markets are focused on the Greek elections this weekend. While the results will likely produce a pop or drop on Monday, I don't think Greece is the real driver here. No matter what the results of the Greek election, the top party will try to forge a coalition and then renegotiate terms with the EU. Yes, regardless of the election results, I think there will be a renegotiation and Greece will stay in the Euro for the time being. The Athens General Index ($ATG) is already pricing in some positive results.
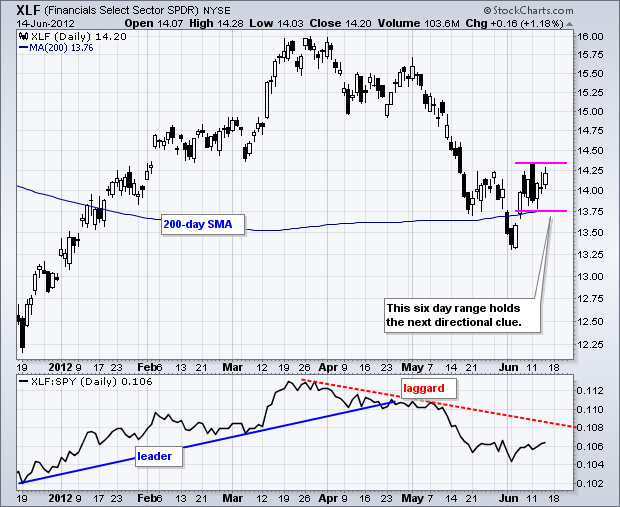
Spain is the real issue for Europe right now. Anyone remember what happened on Monday? The EU announced a 100 billion Euro bailout for Spanish banks. Stocks surged early Monday, but then gave back their gains and closed with losses. Spanish bonds also surged, but then fell back and the yield is now near 7%, its highest since the Euro began. The market's negative reaction to this announcement speaks volumes. First, the market is not buying into band-aid fixes anymore. Second, the market wants lasting changes and bold moves, such as a unified banking system and a political union. These long-term fixes will take time, lots of time. There are now rumors that the G20 is preparing a coordinated response or grand announcement at its summit next week in Mexico. Here we go again. Central banks around the world are preparing the flood the markets with liquidity, which could produce a pop in the stock market and benefit the finance sector. We all know the old Wall Street adage: don't fight the Fed. The bears best be careful when fighting the world's top central banks.
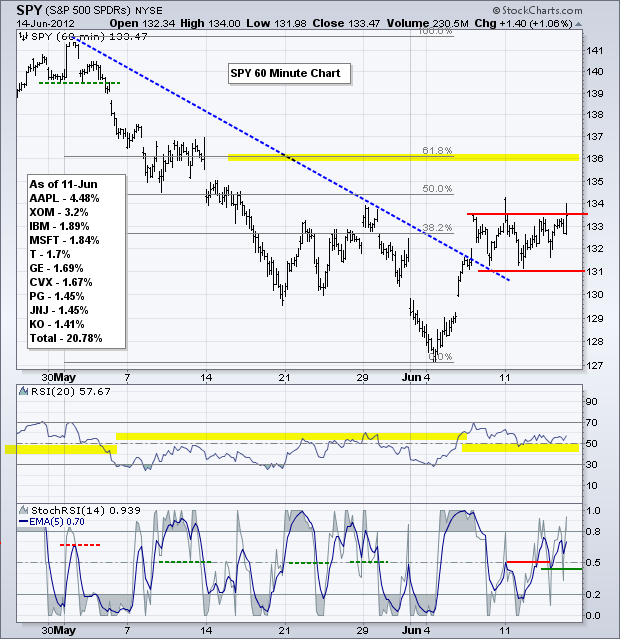
On the 60-minute chart, the S&P 500 ETF (SPY) surged above the May trendline and RSI surged above 60 to start an short-term uptrend. The ETF then moved into a flat consolidation that looks like a flag. These are typically continuation patterns and a break above resistance would open the door to the 136 area. RSI continues to hold the 40-50 zone and remains bullish overall. The 5-period EMA of StochRSI moved back above .50 to turn this momentum indicator bullish again.
**************************************************************************
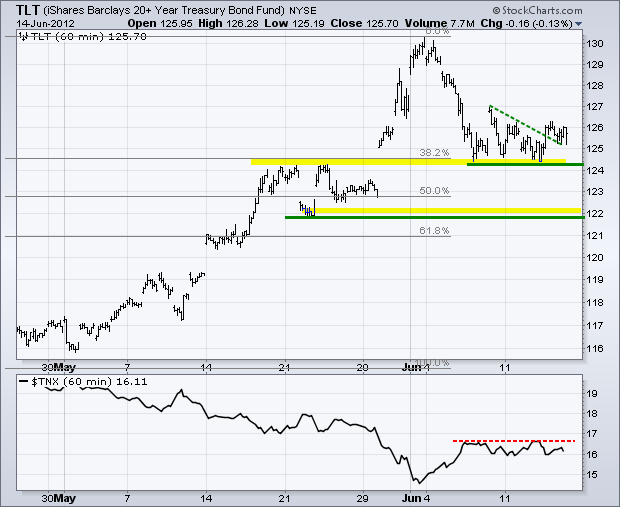
It is going to be one volatile week for treasuries. In addition to the Greek elections, we can look forward to a Fed meeting next week and some G20 jawboning. On the price chart, the 20+ Year T-Bond ETF (TLT) bounced off support and broke the descending triangle trendline. Even though stocks rebounded Thursday, TLT held most of its gains and remains above support. A break below the early June low would argue for a deeper correction towards the 122 area.
**************************************************************************
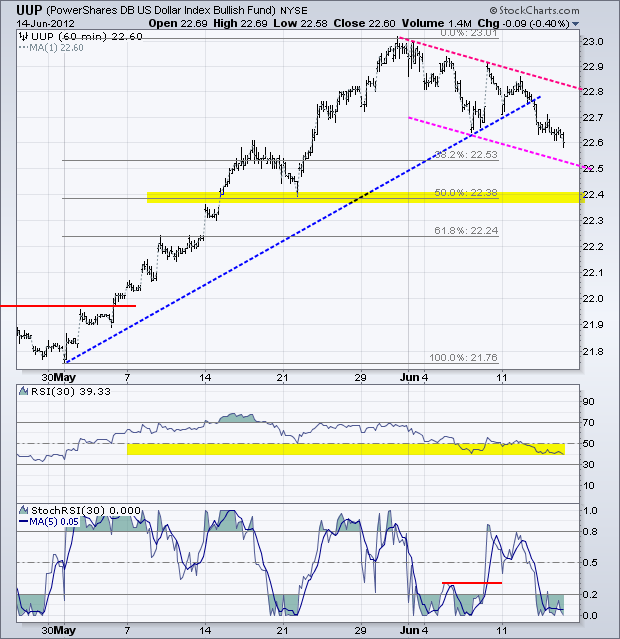
It looks like some short-covering is hitting the Euro ahead of the Greek vote and the US Dollar Fund (UUP) is moving lower. Admittedly, a positive outcome in Greece could send the Euro sharply higher on Monday. With everyone and their dog bearish the Euro right now, we could see one heck of a short covering rally, even if the long-term trend and fundamentals are bearish. A Euro pop and Dollar drop could send UUP to the 50% retracement and May support level around 22.40.
**************************************************************************
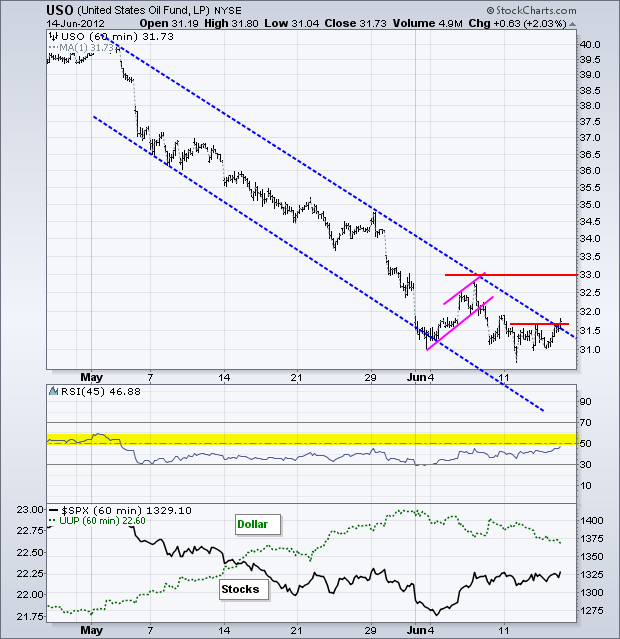
The US Oil Fund (USO) is likely to follow the stock market and the Euro. With both edging higher, USO found support around 31 this week and edged above the falling channel trendline. This is mildly positive and could give way to an oversold bounce towards the 33 area. Also note that the OPEC is finished with its meeting so this news will no longer sway the markets.
**************************************************************************
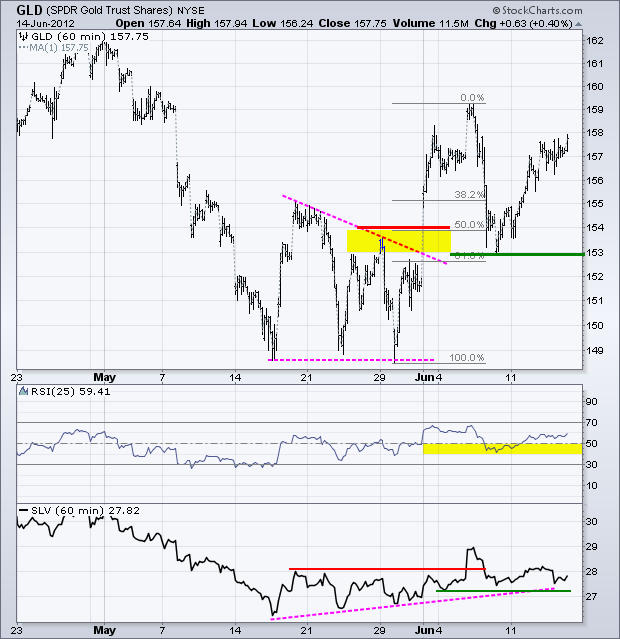
No change. The Gold SPDR (GLD) bounced off support at 153 with a decent surge the last four days. The trend since late May is up and 153 holds the key. I adjusted RSI to 25-periods so it conforms to the current uptrend. Notice how 25-day RSI held the 40-50 zone with last week's decline. This setting puts RSI in harmony with the short-term uptrend in GLD. A break below 40 would turn this momentum indicator bearish.
**************************************************************************
Key Reports and Events:
Fri - Jun 15 - 08:30 - Empire Manufacturing
Fri - Jun 15 - 09:15 - Industrial Production
Fri - Jun 15 - 09:55 - Michigan Sentiment
Sun - Jun 17 - 10:00 – Greek Elections
Mon - Jun 18 - 10:00 – G20 Summit in Mexico
Mon - Jun 19 - 10:00 – G20 Communiqué
Wed - Jun 20 - 12:30 – FOMC Policy Statement
Thu - Jun 21 - 10:00 – Amount for Spanish Bailout Request
Sun - Jun 28 - 10:00 – 2-day EU Summit
Charts of Interest: Tuesday and Thursday
This commentary and charts-of-interest are designed to stimulate thinking. This analysis is not a recommendation to buy, sell, hold or sell short any security (stock ETF or otherwise). We all need to think for ourselves when it comes to trading our own accounts. First, it is the only way to really learn. Second, we are the only ones responsible for our decisions. Think of these charts as food for further analysis. Before making a trade, it is important to have a plan. Plan the trade and trade the plan. Among other things, this includes setting a trigger level, a target area and a stop-loss level. It is also important to plan for three possible price movements: advance, decline or sideways. Have a plan for all three scenarios BEFORE making the trade. Consider possible holding times. And finally, look at overall market conditions and sector/industry performance.

