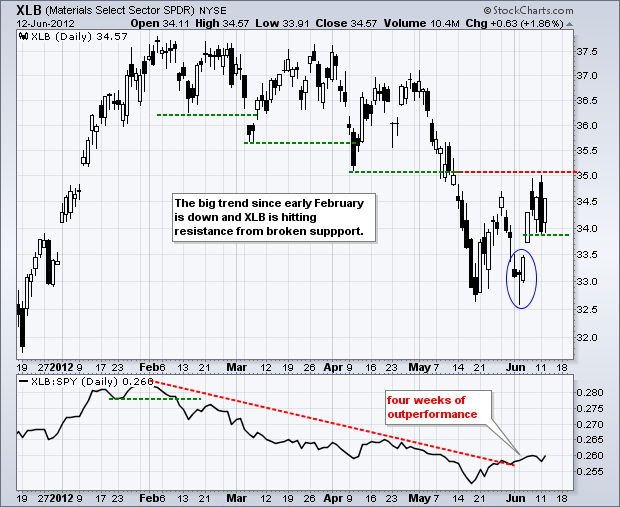
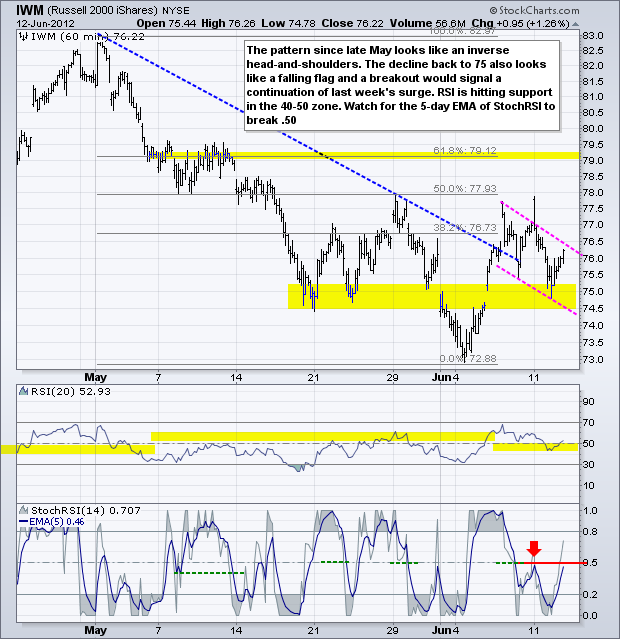
Stocks rebounded after Monday's bearish reversal day with the major index ETFs gaining over 1%. The Dow Industrials SPDR (DIA) led the way with a 1.61% gain, while the S&P MidCap 400 SPDR (MDY) lagged with a 1.01% gain. Eight of nine sectors were up with the Basic Materials SPDR (XLB) and Industrials SPDR (XLI) leading the rebound. We also saw strength within the technology sector with smart gains coming from the Networking iShares (IGN) and Market Vectors Semiconductor ETF (SMH).
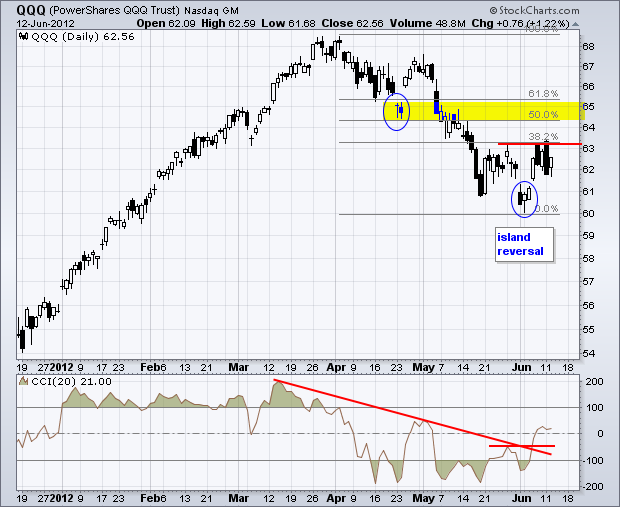
Like the other major index ETFs, the Nasdaq 100 ETF (QQQ) remains stuck between a rock and a hard place. The trend since early April is down, but the ETF forged a short-term reversal with last week's gap up. Follow through has been difficult as the ETF hit resistance from the late May high just above 63. The gap is holding, which makes the short-term cup half full. However, QQQ needs to close above this week's high to reverse the medium-term downtrend. The indicator window shows the Commodity Channel Index (CCI) breaking above its late May high and edging into positive territory. Short-term momentum favors the bulls as long as CCI remains positive.
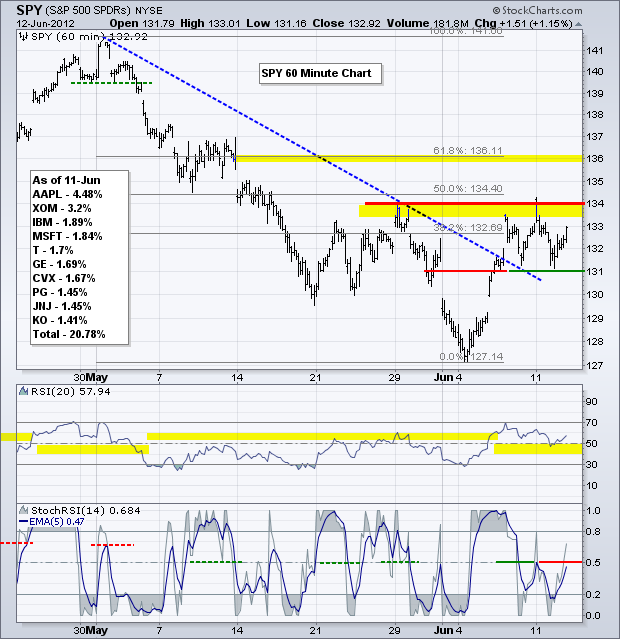
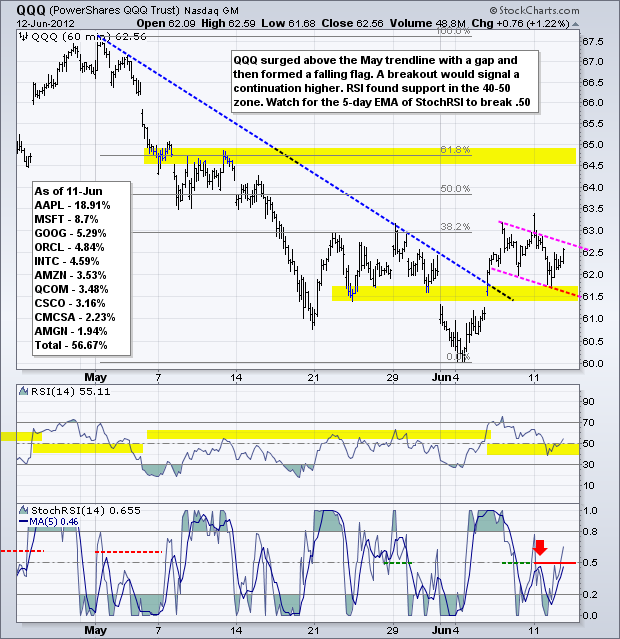
On the 60-minute chart, the S&P 500 ETF (SPY) held support at 131 and bounced back towards 133 on Tuesday. There is still a lot of resistance around 134, but the bulls are showing resilience with this bounce. Last week's gap held, support at 131 held and RSI bounced off the 40-50 zone. These bullish factors are countered by stiff resistance at 134 and the 5-day EMA of StochRSI has yet to break back above .50. The choppy trading over the last four days could be a consolidation (rest) after a surge. This means we may see a continuation higher and move towards the 136 area (61.80% retracement). The bullish first signal would likely be the 5-day EMA of StochRSI breaking above .50.
**************************************************************************
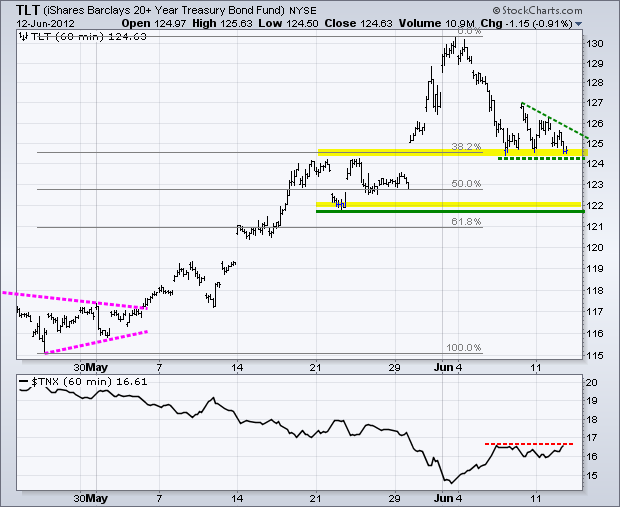
The 20+ Year T-Bond ETF (TLT) is still testing support in the 124 area. A descending triangle could be taking shape and a break below the late May low would signal a continuation of the early June decline. This would target a move to the next support zone around 122. A break above this week's high would negate the descending triangle and put the bulls back in charge.
**************************************************************************
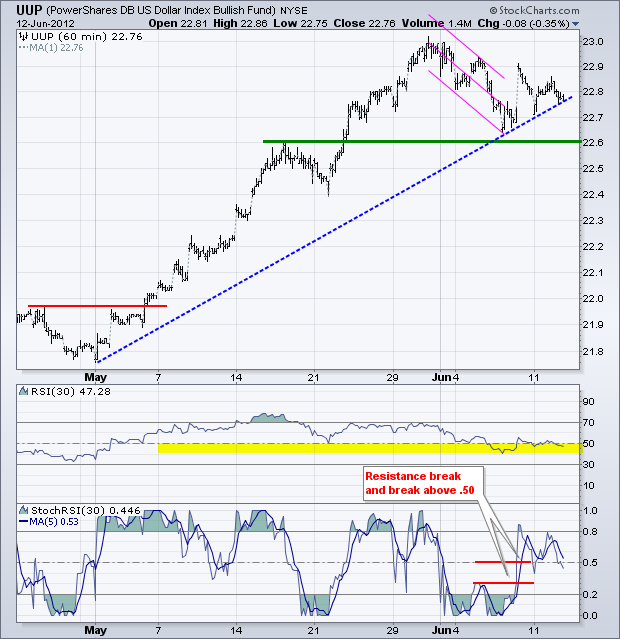
The US Dollar Fund (UUP) remains in an uptrend, but this uptrend slowed as the ETF consolidated the last two weeks. After a pullback towards broken resistance at 22.60, UUP surged and broke the Raff Regression Channel. Despite this bullish break, the ETF stalled the last few days and did not follow through. Nevertheless, the cup remains half full as long as 22.60 support holds and RSI holds support at 40.
**************************************************************************
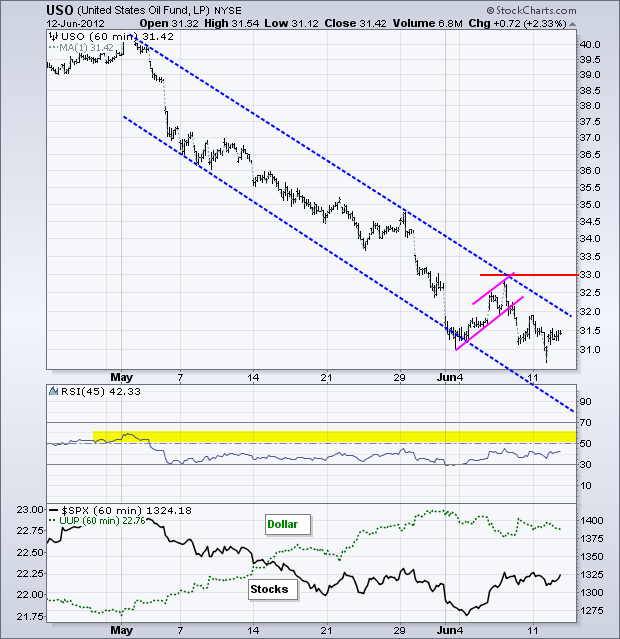
The US Oil Fund (USO) managed a bounce on Tuesday, but remains in a falling channel and clear downtrend overall. A break above the upper trendline would provide the first sign of strength and follow through above 33 would reverse this downtrend. Look for confirmation with an RSI break above 60.
**************************************************************************
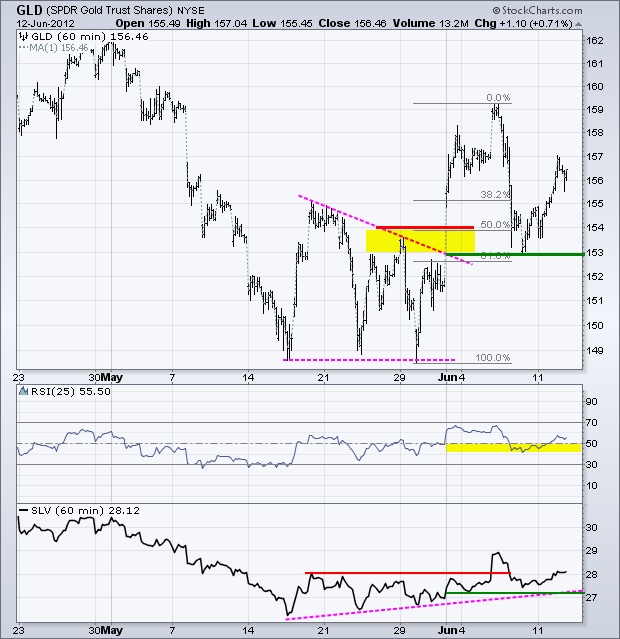
The Gold SPDR (GLD) bounced off support at 153 with a decent surge the last three days. The trend since late May is up and 153 holds the key. I adjusted RSI to 25-periods so it conforms to the current uptrend. Notice how 25-day RSI held the 40-50 zone with last week's decline. This setting puts RSI in harmony with the short-term uptrend in GLD. A break below 40 would turn this momentum indicator bearish.
**************************************************************************
Key Economic Reports:
Wed - Jun 13 - 07:00 - MBA Mortgage Index
Wed - Jun 13 - 08:30 - Retail Sales
Wed - Jun 13 - 08:30 - Producer Price Index (PPI)
Wed - Jun 13 - 10:00 - Business Inventories
Wed - Jun 13 - 10:30 - Oil Inventories
Thu - Jun 14 - 08:30 - Jobless Claims
Thu - Jun 14 - 08:30 - Consumer Price Index (CPI)
Fri - Jun 15 - 08:30 - Empire Manufacturing
Fri - Jun 15 - 09:15 - Industrial Production
Fri - Jun 15 - 09:55 - Michigan Sentiment
Sun - Jun 17 - 10:00 – Greek Elections
Wed - Jun 20 - 12:30 – FOMC Policy Statement
Thu - Jun 21 - 10:00 – Amount for Spanish Bailout Request
Sun - Jun 28 - 10:00 – 2-day EU Summit
Charts of Interest: Tuesday and Thursday
This commentary and charts-of-interest are designed to stimulate thinking. This analysis is not a recommendation to buy, sell, hold or sell short any security (stock ETF or otherwise). We all need to think for ourselves when it comes to trading our own accounts. First, it is the only way to really learn. Second, we are the only ones responsible for our decisions. Think of these charts as food for further analysis. Before making a trade, it is important to have a plan. Plan the trade and trade the plan. Among other things, this includes setting a trigger level, a target area and a stop-loss level. It is also important to plan for three possible price movements: advance, decline or sideways. Have a plan for all three scenarios BEFORE making the trade. Consider possible holding times. And finally, look at overall market conditions and sector/industry performance.

About the author:
Arthur Hill, CMT, is the Chief Technical Strategist at TrendInvestorPro.com. Focusing predominantly on US equities and ETFs, his systematic approach of identifying trend, finding signals within the trend, and setting key price levels has made him an esteemed market technician. Arthur has written articles for numerous financial publications including Barrons and Stocks & Commodities Magazine. In addition to his Chartered Market Technician (CMT) designation, he holds an MBA from the Cass Business School at City University in London.
Learn More
