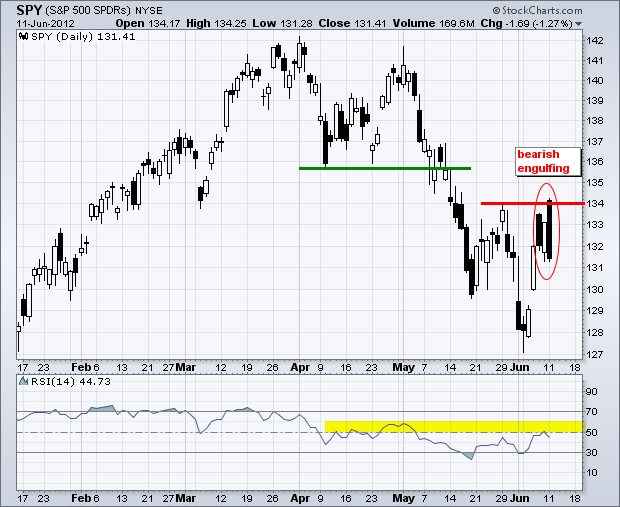
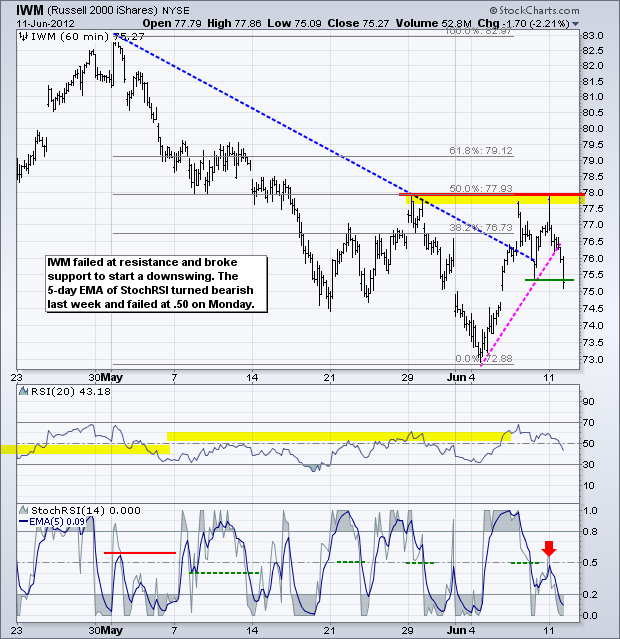
Stocks surged on the open with the S&P 500 exceeding 1335 in the first 5 minutes of trading. Selling pressure hit after five minutes of euphoria and the index closed below 1308. $SPX swung 2% from high to low and closed down over 1% on the day. Overall, small-caps and mid-caps led the decline as the S&P MidCap 400 SPDR (MDY) plunged over 3%. All sectors were down with the Basic Materials SPDR (XLB) and the Finance SPDR (XLF) leading lower. All in all, Monday was a big failure for the bulls. Bearish engulfing patterns and dark cloud patterns formed in many ETFs and stocks. The chart below shows the S&P 500 ETF (SPY) forming a large bearish engulfing to affirm resistance in the 134 area. Also notice that RSI turned down from the 50-60 resistance zone.
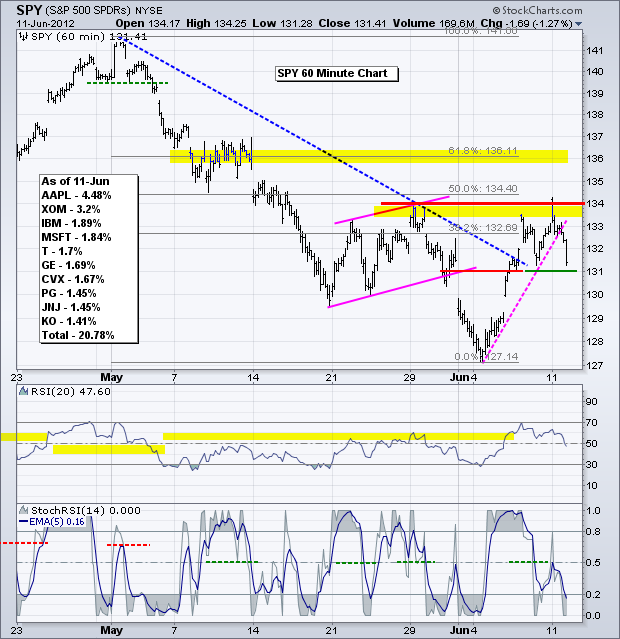
On the 60-minute chart, SPY failed to hold above 134 and broke the early June trendline with a sharp decline. Support at 131 remains, but the swing is now down with resistance at 133.20. The 5-day EMA of StochRSI broke below .50 last week and failed at .50 on Monday. This smoothed indicator managed to hold its bearish signal, just as it did in late May. A surge above .50 would suggest an upturn in short-term momentum.
**************************************************************************
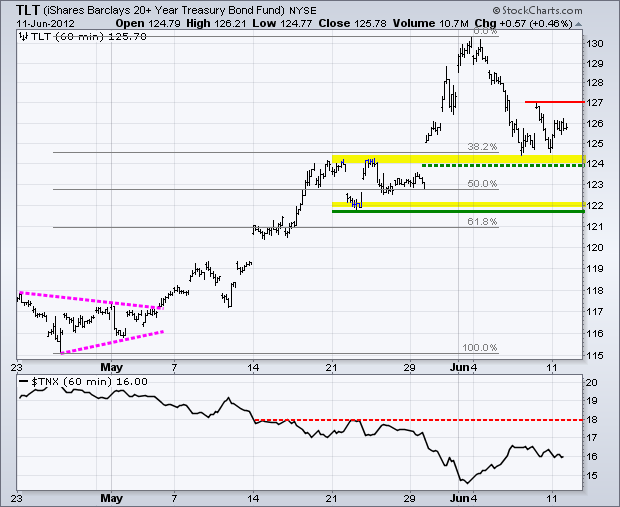
Treasuries are at the mercy of the Euro and the stock market. Nobody is buying treasuries on their own merits. Buyers merely seek a safe-haven until the storm passes. The 20+ Year T-Bond ETF (TLT) is bouncing off support at 124 and remains in an uptrend overall. The ETF was way overbought at 130 and has now alleviated this condition. A break above 127 would signal a resumption of the uptrend.
**************************************************************************
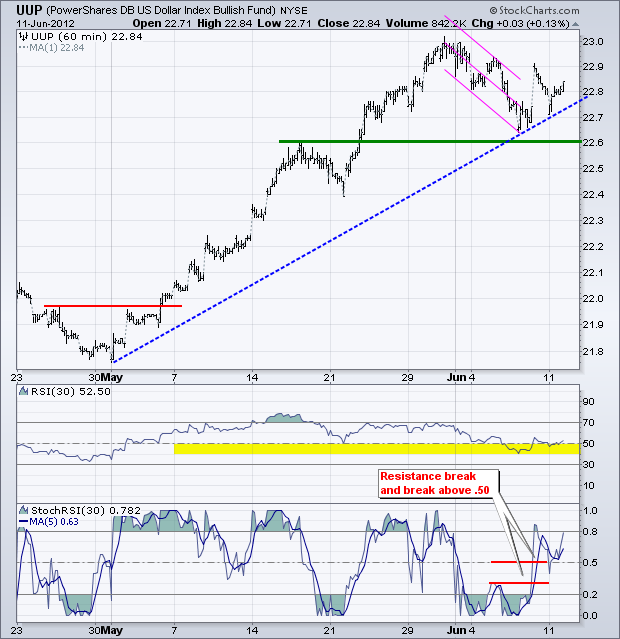
The US Dollar Fund (UUP) opened weak, but moved higher after the open to affirm support in the 22.60 area. The bigger trend remains up and last week's decline was reversed with a surge above 22.85 last week. I adjusted RSI to 30 periods so it now reflects the June bounce and overall uptrend. RSI should hold 40 in an uptrend and 30-period RSI held 40 last week. I am also setting StochRSI at 30 to match RSI. A resistance breakout in the 5-day EMA or break above .50 signals a resumption of the uptrend. Keep in mind that StochRSI is much more sensitive than RSI and will generate more signals. Look for bullish StochRSI signals when RSI is in bull mode.
**************************************************************************
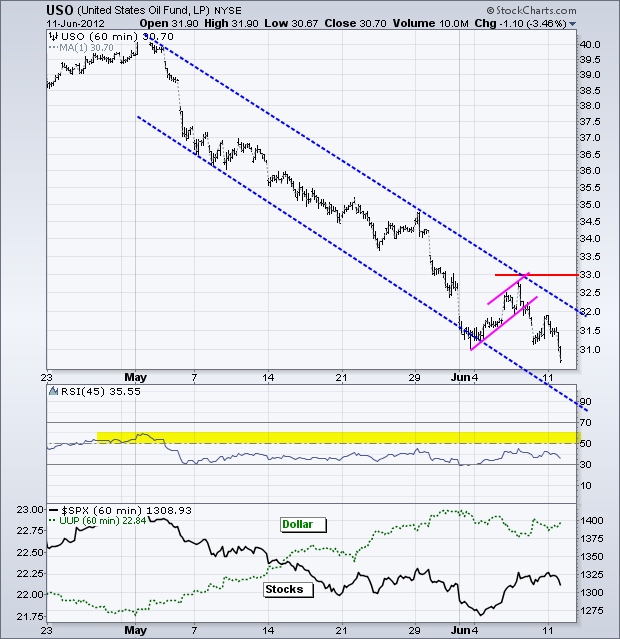
The US Oil Fund (USO) cannot hold a bid to save its life. Global economic conditions and the European crisis are dominating trade in oil. The Middle East and Syria are on the back burner, at best. USO broke flag support last week, tried to bounce on Friday and moved to new lows on Monday. Ouch. USO resistance remains at 33 and RSI Resistance at 60.
**************************************************************************
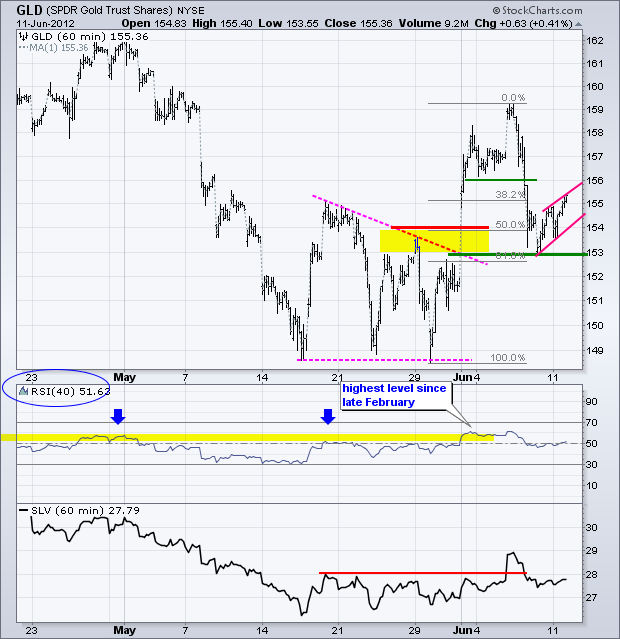
It is hard to say what is driving gold, but I think gold would benefit form a strong Euro and strong stock market. Conversely, a strong Dollar and weak stock market would be bearish for bullion. The Gold SPDR (GLD) bounced off broken resistance the last two days and this reinforces support at 153. There is some concern that a rising flag is taking shape, but the bulls have an edge as long as the flag rises. A flag break and support break would put gold back with the bears.
**************************************************************************
Key Economic Reports:
Wed - Jun 13 - 07:00 - MBA Mortgage Index
Wed - Jun 13 - 08:30 - Retail Sales
Wed - Jun 13 - 08:30 - Producer Price Index (PPI)
Wed - Jun 13 - 10:00 - Business Inventories
Wed - Jun 13 - 10:30 - Oil Inventories
Thu - Jun 14 - 08:30 - Jobless Claims
Thu - Jun 14 - 08:30 - Consumer Price Index (CPI)
Fri - Jun 15 - 08:30 - Empire Manufacturing
Fri - Jun 15 - 09:15 - Industrial Production
Fri - Jun 15 - 09:55 - Michigan Sentiment
Sun - Jun 17 - 10:00 – Greek Elections
Thu - Jun 21 - 10:00 – Amount for Spanish Bailout Request
Sun - Jun 28 - 10:00 – 2-day EU Summit
Charts of Interest: Tuesday and Thursday
This commentary and charts-of-interest are designed to stimulate thinking. This analysis is not a recommendation to buy, sell, hold or sell short any security (stock ETF or otherwise). We all need to think for ourselves when it comes to trading our own accounts. First, it is the only way to really learn. Second, we are the only ones responsible for our decisions. Think of these charts as food for further analysis. Before making a trade, it is important to have a plan. Plan the trade and trade the plan. Among other things, this includes setting a trigger level, a target area and a stop-loss level. It is also important to plan for three possible price movements: advance, decline or sideways. Have a plan for all three scenarios BEFORE making the trade. Consider possible holding times. And finally, look at overall market conditions and sector/industry performance.

