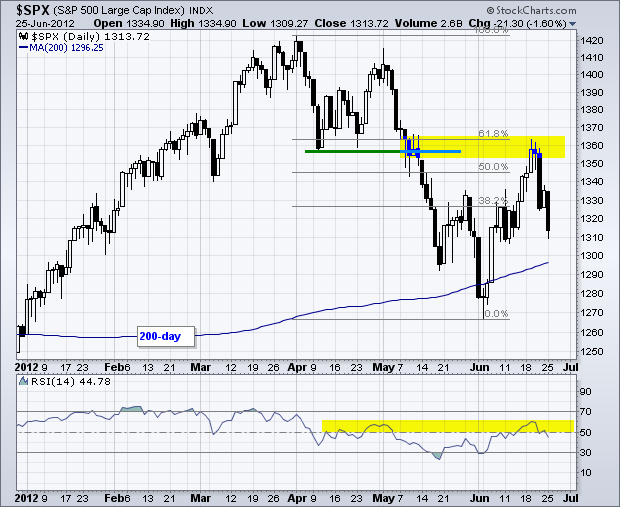
Stocks moved sharply lower on Monday with an extremely weak opening. The major index ETFs gapped down on the open, drifted lower throughout the morning and then edged off their lows in the afternoon. Even though selling pressure abated in the afternoon, buying pressure was certainly uninspiring and the gaps remained. All sectors were lower with the Finance SPDR (XLF), Technology SPDR (XLK) and Energy SPDR (XLE) falling over 2%. The defensive sectors (XLV, XLP, XLU) held up the best and had the smallest losses. Taking a long-term and institutional perspective, the S&P 500 is setting up for another test of the 200-day moving average in the 1300 area.
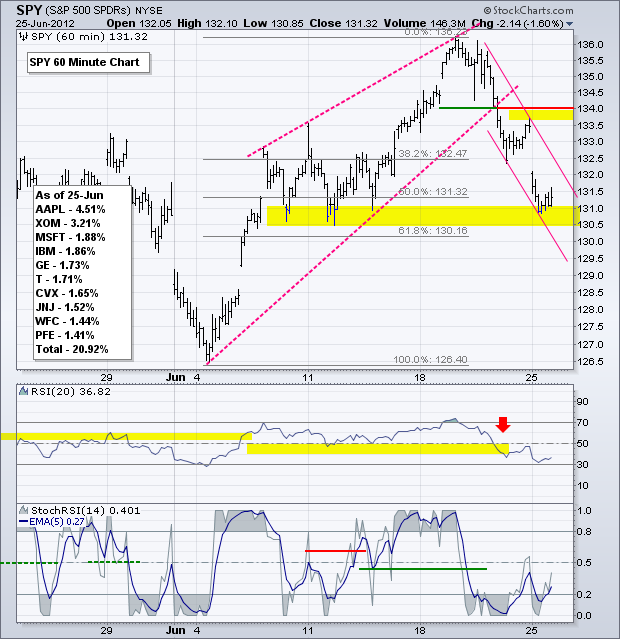
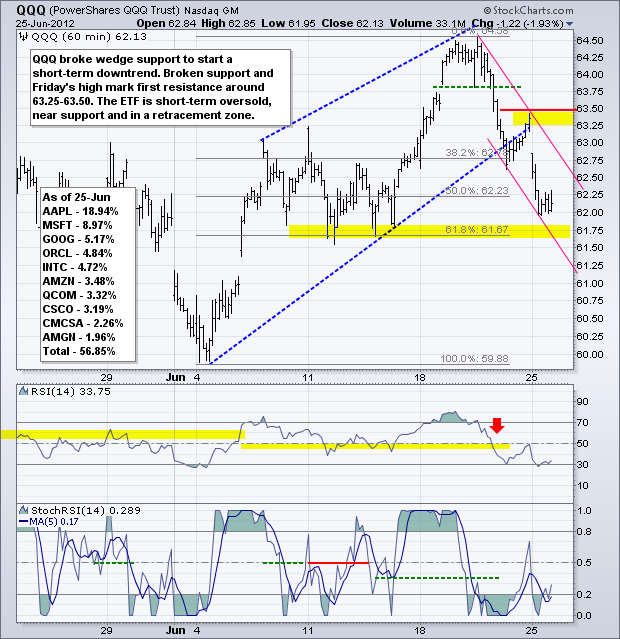
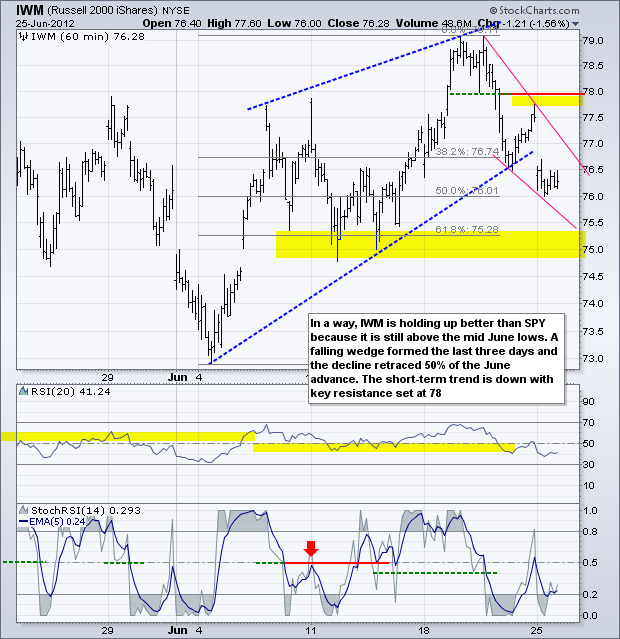
With a 3% decline in three days, the S&P 500 ETF (SPY) is short-term oversold and support around 131 is coming into play. Support in this area stems from the mid June lows. Also notice that the decline retraced 50-61.80% of the prior advance. This trio (oversold, support, retracements) could lead to a consolidation or oversold bounce back towards the 132.5-133.5 area. RSI broke below 40 to turn momentum bearish and resistance will be set at 60. The 5-period EMA of StochRSI is wallowing below .50. At this point, I will wait for a bearish setup in this ultra sensitive indicator. A move above .80 would set up a short-term overbought condition and a subsequent break back below .40 would signal the beginning of another swing lower.
**************************************************************************
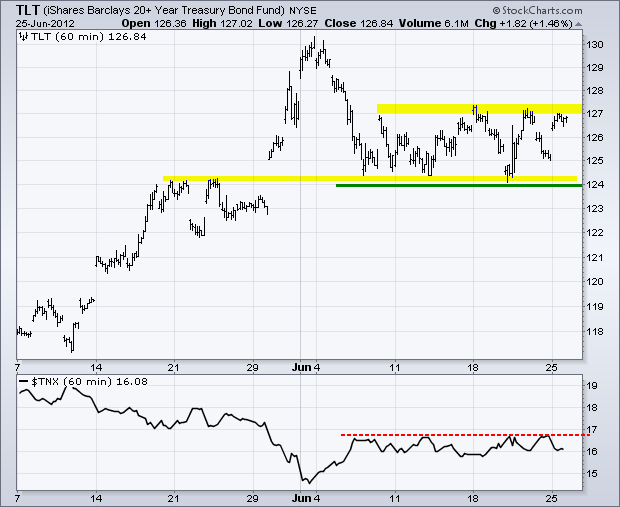
As expected, the 20+ Year T-Bond ETF (TLT) surged as stocks and the Euro plunged. The surge in TLT was, however, a little muted because the ETF did not break resistance. Perhaps treasuries are looking a little pricey and less of a safe-haven. Resistance in the 127 area extends back to early June and this level has held at least three times. A breakout would call for an extension of the uptrend and this could be very bearish for stocks. The 10-year Treasury Yield ($TNX) is also stuck in a range. A break above the June highs would be bullish for $TNX and bearish for TLT.
**************************************************************************
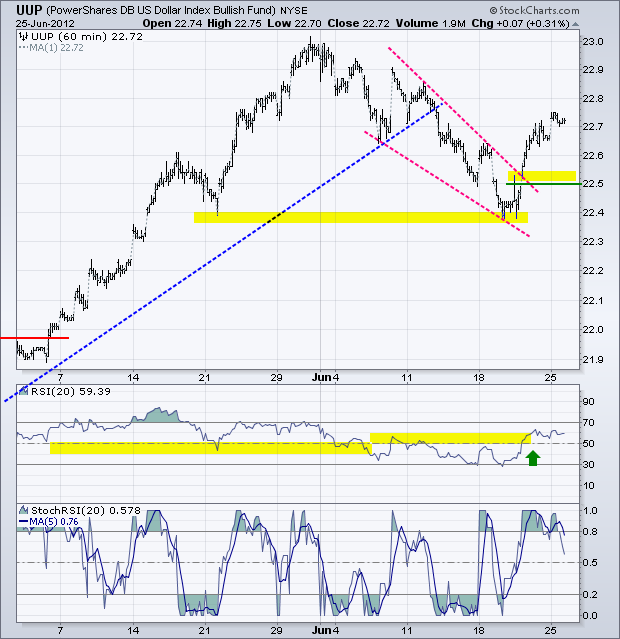
The US Dollar Fund (UUP) moved higher as well, but the surge was relatively muted considering the carnage in stocks and fears in Europe. Nevertheless, the falling wedge breakout remains the dominant chart feature. Broken resistance turns first support at 22.50. A move below this level would clearly negate the breakout. While hopes of something big from the EU summit have been dashed, do not be surprised to see the "promise" of something big, such as a blueprint to guarantee the banking system. A big idea may produce a pop in the Euro, but it would take concrete action to produce a sustainable advance. Getting 17 members to agree (and act) on concrete action will not happen overnight. It will take months.
**************************************************************************
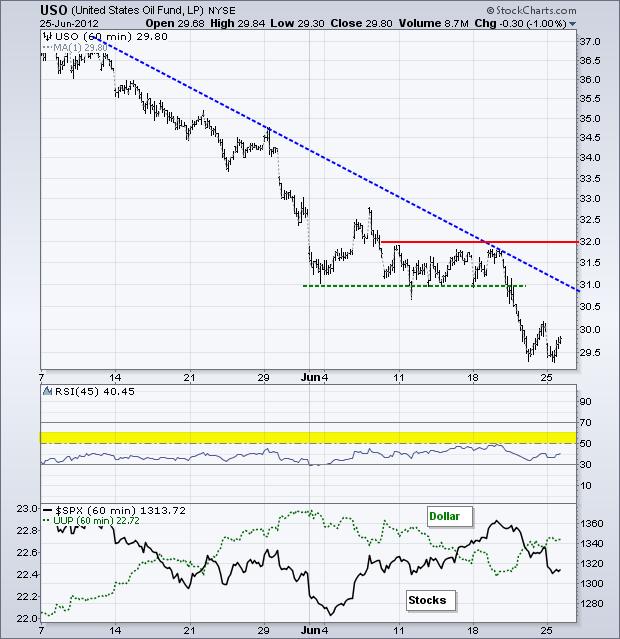
The US Oil Fund (USO) fell along with the stock market and Euro, but did find some support near last week's low. This could pave the way for an oversold bounce, provided stocks and the Euro bounce. Broken support and the May trendline mark first resistance in the 31 area. Key resistance remains at 32.
**************************************************************************
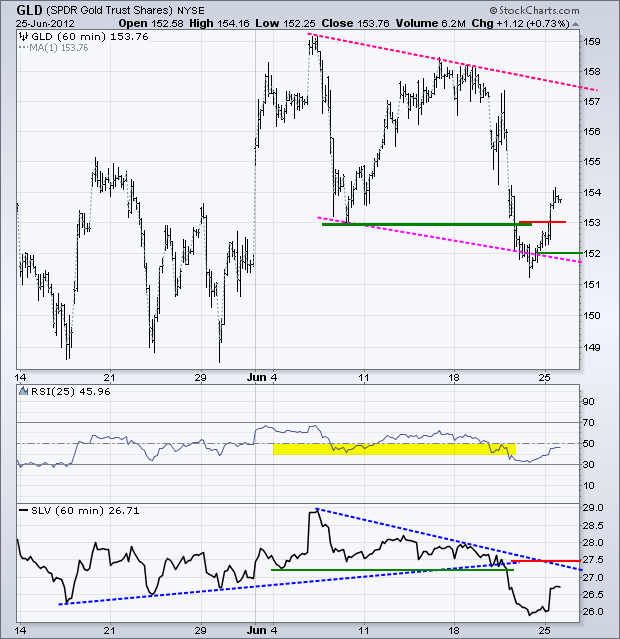
The Gold SPDR (GLD) is making life interesting with a surge back above 153. Is this enough to negate the support break? Perhaps, but the June trend is clearly down with a large falling channel taking shape. The swing within this channel is up with the break above 153 and I would mark swing support at 152. A move above 158 would break the channel and signal a continuation of the late May surge. Such a breakout would have medium-term consequences as well.
**************************************************************************
Key Reports and Events:
Tue - Jun 26 - 09:00 - Case-Shiller 20-city Index
Tue - Jun 26 - 10:00 - Consumer Confidence (Conference Board)
Wed - Jun 27 - 08:30 – Durable Goods Orders
Wed - Jun 27 - 10:00 - Pending Home Sales
Wed - Jun 27 - 10:30 - Oil Inventories
Thu - Jun 28 - 08:30 – Initial Jobless Claims
Thu - Jun 28 - 08:30 – GDP
Thu - Jun 28 - 08:30 – Supreme Court Healthcare Ruling?
Thu - Jun 28 – 08:30 – 2-day EU Summit Begins
Fri - Jun 29 - 08:30 - Personal Income & Spending
Fri - Jun 29 - 09:45 - Chicago Purchasing Managers Index (PMI)
Fri - Jun 29 - 09:55 - Michigan Sentiment
Fri - Jun 29 - 12:00 – 2-day EU Summit Ends
Thu - Jul 05 - 10:00 – European Central Bank Policy Statement
Charts of Interest: Tuesday and Thursday
This commentary and charts-of-interest are designed to stimulate thinking. This analysis is not a recommendation to buy, sell, hold or sell short any security (stock ETF or otherwise). We all need to think for ourselves when it comes to trading our own accounts. First, it is the only way to really learn. Second, we are the only ones responsible for our decisions. Think of these charts as food for further analysis. Before making a trade, it is important to have a plan. Plan the trade and trade the plan. Among other things, this includes setting a trigger level, a target area and a stop-loss level. It is also important to plan for three possible price movements: advance, decline or sideways. Have a plan for all three scenarios BEFORE making the trade. Consider possible holding times. And finally, look at overall market conditions and sector/industry performance.

About the author:
Arthur Hill, CMT, is the Chief Technical Strategist at TrendInvestorPro.com. Focusing predominantly on US equities and ETFs, his systematic approach of identifying trend, finding signals within the trend, and setting key price levels has made him an esteemed market technician. Arthur has written articles for numerous financial publications including Barrons and Stocks & Commodities Magazine. In addition to his Chartered Market Technician (CMT) designation, he holds an MBA from the Cass Business School at City University in London.
Learn More
